
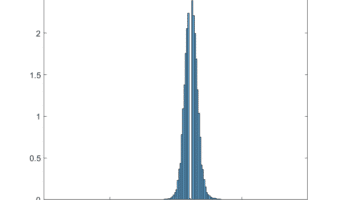
Here’s the scene, photographed with a Hasselblad X2D, 90mm XCD lens, and developed in Lightroom with default settings. Here’s the raw histogram, log-log presentation: Looks like it’s ETTR, but maybe too conservative. Here’s the raw histogram with a linear y-axis: That makes it look a stop or so underexposed from ETTR. Here’s the in-camera histogram:… [Read More]
Search Results for: histogram
Histograms, low contrast scene with specular highlight

In the previous post, I looked at in-camera, raw, and developed histograms for a normal-contrast scene. We saw that deciding on the correct exposure required consideration of how much specular and near-specular highlights should be protected. For this post, I wanted a low-contrast scene. I got one, but there’s a specular highlight that I didn’t… [Read More]
Histogram example, normal-contrast scene

In the previous post I looked at lots of ways to display histograms. In this one, I’m going to take a scene with normal outdoor contrast, and look at the relevant histograms. Here’s the scene, as captured by a Hasselblad X2D with a 90 mm XCD lens, at close to ETTR (more on that later),… [Read More]
A deep dive into histograms
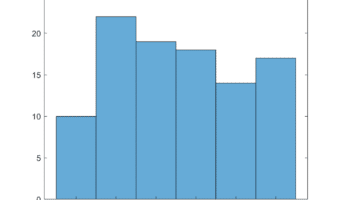
Around the turn of the 20th century, Karl Pearson, an English mathematician and statistician, invented the histogram as a way of presenting data. Originally, the histogram was a kind of bar chart, with the x-axis divided into intervals — now called buckets or bins — and a bar for each bin indicating how many items… [Read More]
Leica Q2 Monochrom dark-field ISO histograms
This is the sixth post in a series about the Leica Q2 Monochrom. You can see all the other posts in the series by looking in the Category List drop-down menu on the right side of the page. In this post, I reported ono some anomalies in the Leica Q2 Monochrom dark-field histograms. I had… [Read More]
- 1
- 2
- 3
- …
- 52
- Next Page »