This is a continuation of a series of posts on the Sony a7RIII. You should be able to find all the posts about that camera in the Category List on the right sidebar, below the Articles widget. There’s a drop-down menu there that you can use to get to all the posts in this series. You can also click on the “a7RIII” link in the “You are here” line at the top of this post.
Since this post, I’ve gotten lots of help from Mark, Bill Claff, Jack Hogan, and Joofa. Thanks to them, I’ve written code to detect and measure prescaling gain in cameras, and have corrected the full well capacities (FWCs) using that information. My a7RIII has a prescaling digital gain of 1.0391 applied to all four raw planes. The gain may vary with serial number, and for that matter, temperature. It will be interesting to see what other people get for the gain when they measure their cameras.
This morning I ran photon transfer curves (PTCs) for a bunch of different a7RIII ISO settings.
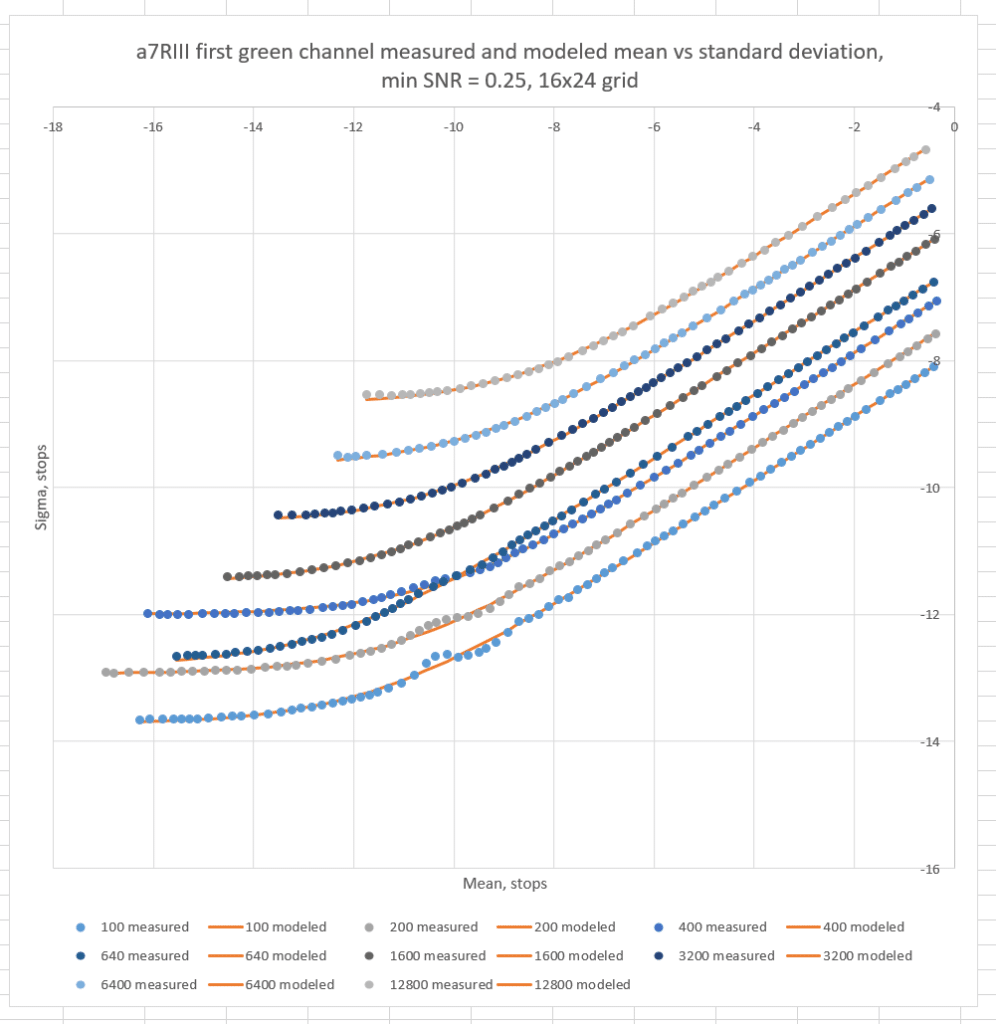
ISOs 100, 200, and 400 on the a7RIII have the sensor in low-conversion gain mode. ISO 640 and above use the high conversion gain. You can see what a difference that makes. You can also see that the rippling that the prescaling gains causes is largely invisible at ISO 640 and above. You can also see that the modeling is fairly accurate.
Although it’s not shown above because it would make the graph too messy, I did PTCs for all the intermediate ISOs. Here are the modeled FWCs vs ISO:
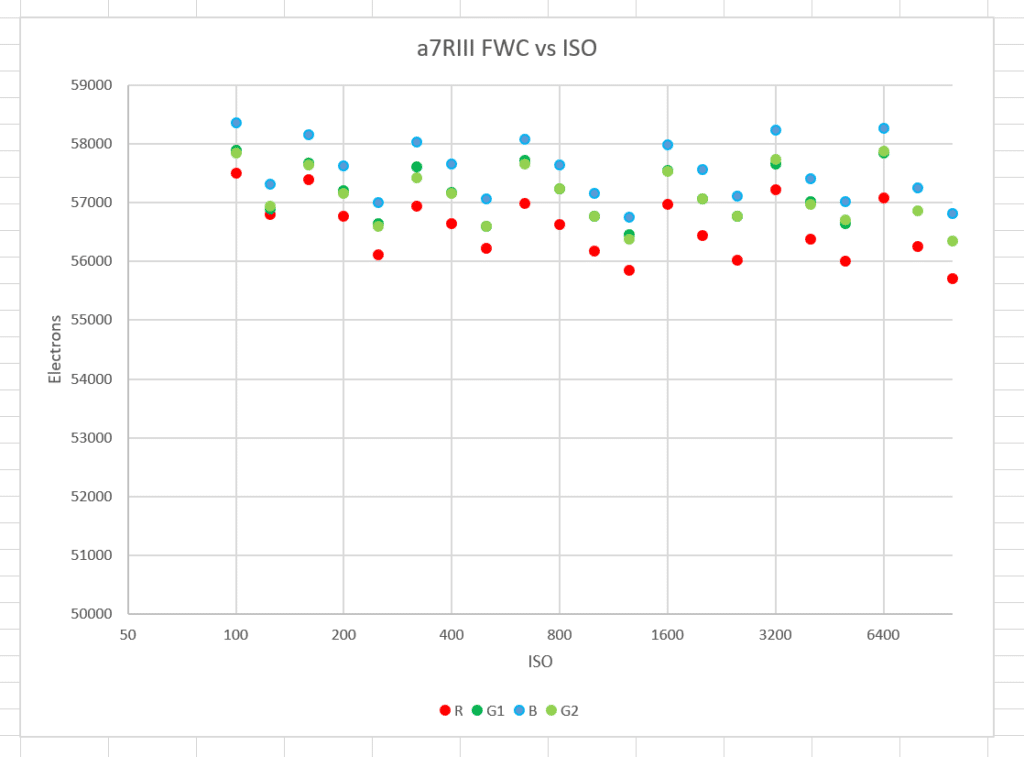
These FWCs are referred to base ISO. Here’s what that means: it is possible to look at a PTC at any ISO, and, if you know that ISO and the base ISO, estimate what the FWC is at base ISO, and that’s what I did. As the ISO level increases to the point where the RN makes estimating the photon noise more difficult, the estimated FWCs become less accurate. Therefore, it is a useful check on the data and whether the correct model has been chosen to estimate base-ISO FWC from data sets derived at as many ISOs as practical. In a perfect world, they would all yield the same number.
There is something interesting about this graph. There seems to be a sawtooth periodicity at roughly — but not always — whole f-stop steps. I have no idea what that’s about. I checked to see if the prescaling gain varied with ISO setting, but, at least up to 1600 or so (which is where I got bored) it doesn’t. The higher FWCs for the blue channel may be the result of Sony interpolating over PDAF pixels.
Here’s the input-referred read noise that the modeler picked:
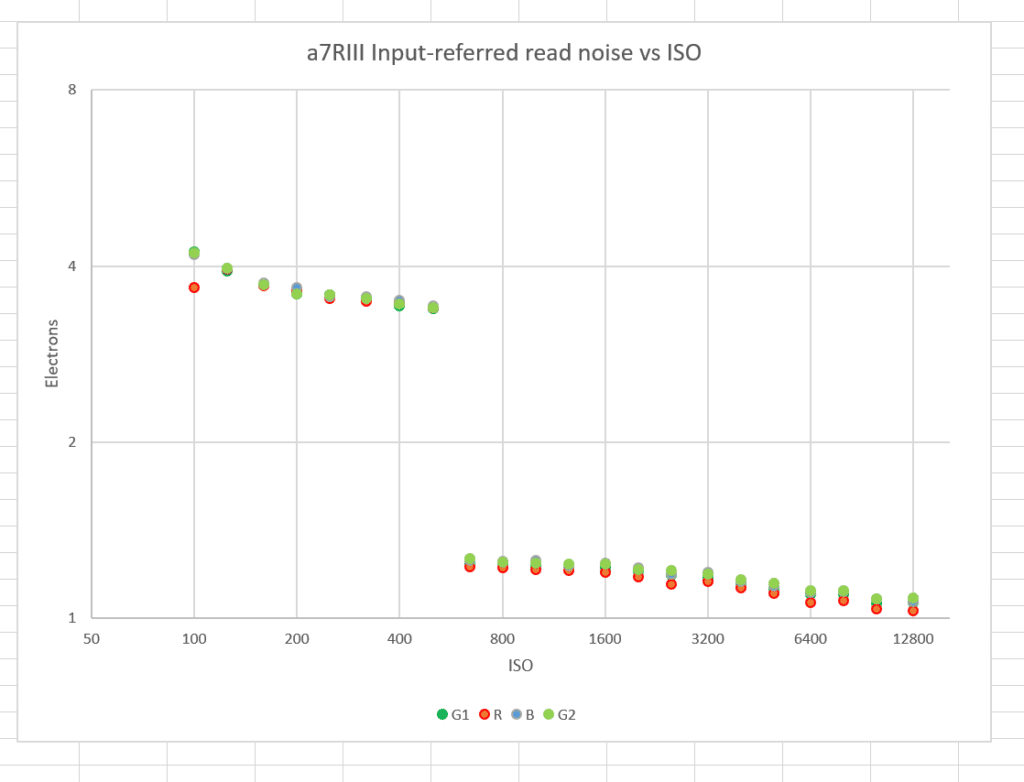
The red-channel ISO 1000 result is an outlier, and may be an error. The DR-Pix conversion gain changing technology does a great job at ISOs 640 and above.
By the way, this is my current setup for capturing the data for the PTCs:
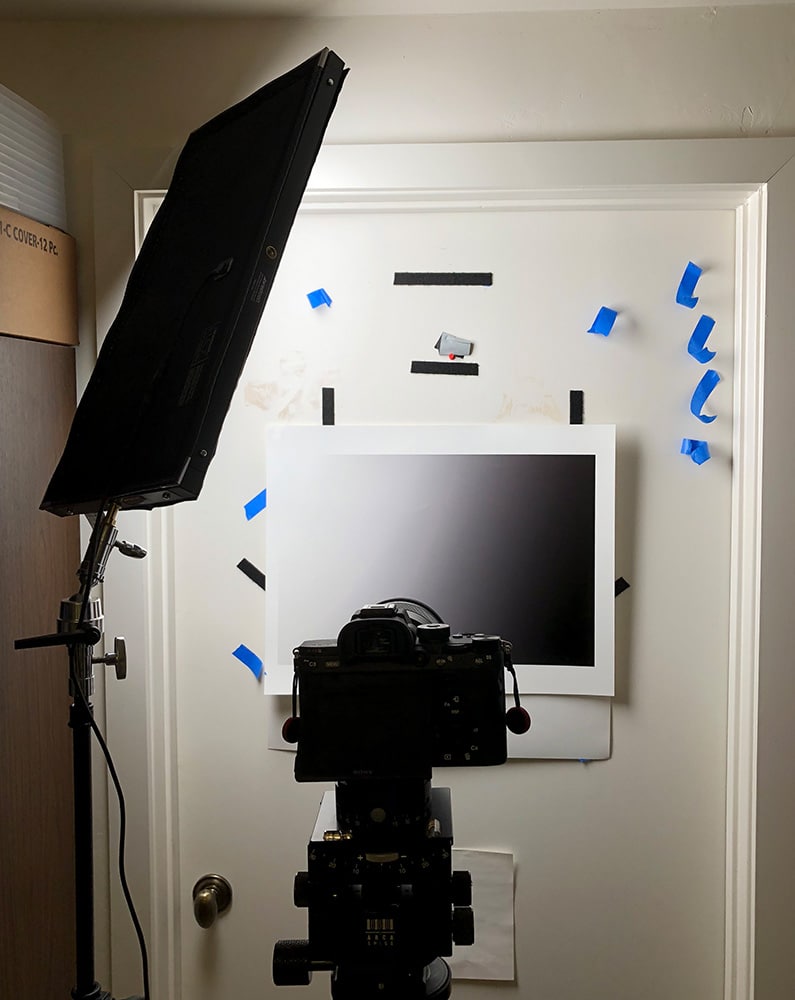
The target is a double gradient, and it’s lit in a direction that makes the gradient steeper. Because I subtract pairs to get the data the smooth gradient is not a problem. For the curves above I selected 384 200×200 pixel squares in a 16×24 square grid for analysis at each exposure level, and I used four exposure levels per ISO (4 pairs of exposures, for a total of 8 exposures per ISO).
Iliah Borg says
> There seems to be a sawtooth periodicity at roughly — but not always — whole f-stop steps.
Possibly, from correction of vignetting. One way to check is to use a lens that the camera doesn’t recognize.
Horshack says
The sawtooth pattern between the intermediate ISOs looks like software gain, like what some Canon cameras use in the absence of hardware analog gain support for intermediate ISOs.
JimK says
It would have to be gain that doesn’t cause the histogram to comb.
JimK says
If the intermediate ISOs were achieved with digital gain only, the FWC effect would be much greater. Note that the bottom of the graph is not zero.
Ilya Zakharevich says
> “There seems to be a sawtooth periodicity at roughly — but not always — whole f-stop steps. I have no idea what that’s about.”
To get these numbers, you multiplied the measured FWC by some coefficients. The coefficients depend on the REPORTED sensitivity. I suppose You took these coefficients out of the clear blue sky. The graphs show (?) that your coefficients were wrong, and show how to improve them.
(They do not show how to interpret the “improved” coefficients. I did not think about it — and without thinking, I have no clue…)
JimK says
You are correct about the multiplication depending on the reported sensitivity. However, that’s not taking them out of a clear blue sky. If you don’t see the point of trying to adjust the coefficients, that’s fine; I don’t either.
Ilya Zakharevich says
> “If you don’t see the point …”
It is not that I do not see the point — just did not get tuits! You did show it many times that a meticulous attention to details can (eventually!) lead to very interesting insights.
So now that you have shown HOW to calculate the coefficients hardwired into the ISO switchers, analyzing what they are exactly MIGHT be very beneficial — now that we know they do not follow a trivial mathematical formula. This may be just a issue of having rounded numbers in some table; but it may be something else too…