• site home
  • blog home
  • galleries
  • contact
  • underwater
  • the bleeding edge

the last word

Photography meets digital computer technology. Photography wins -- most of the time.

You are here: Home / Z9 / Visual effects of Nikon Z9 conversion gain switching, no NR

Visual effects of Nikon Z9 conversion gain switching, no NR

January 30, 2022 JimK Leave a Comment

This is one in a series of posts on the Nikon Z9. You should be able to find all the posts about that camera in the Category List on the right sidebar, below the Articles widget. There’s a drop-down menu there that you can use to get to all the posts in this series; just look for “Z9”.

In this post I showed you photon transfer curves (PTCs) for the Nikon Z9 at various ISO settings. I received some requests to show how the camera’s handling of the conversion gain affects images visually, and this post is intended to do some of that. First off, you need to understand that the Z9, like so many modern cameras, has two conversion gains. There’s a low conversion gain, which is used for ISOs 64 through 400, and a higher one that is used for ISO 500 and ISO settings above that.

Here are the PTCs for ISO 64 and ISO 500.

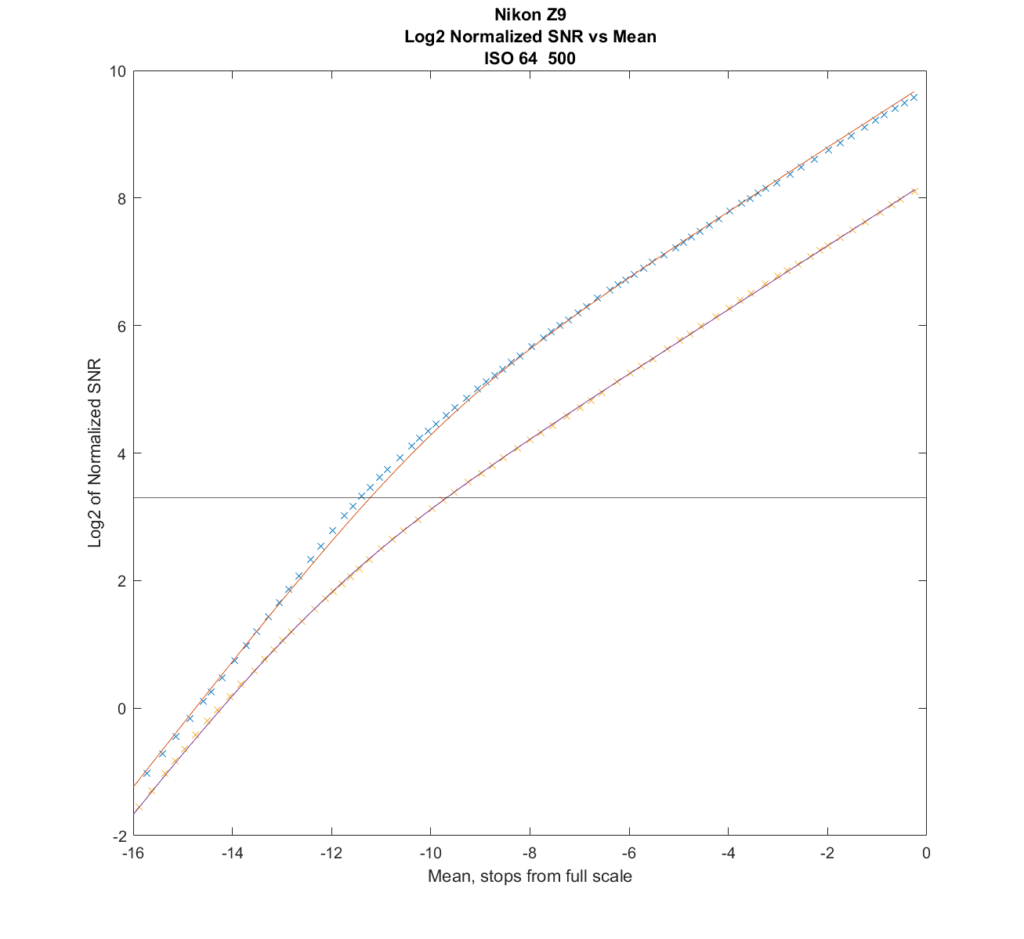
Here’s an explanation of the above graph. The crosses are measured points. The lines are what a camera model that I fitted to the data says the SNR should be. The horizontal axis is the mean signal level in stops from full scale. The vertical axis is the signal to noise ratio (SNR) normalized to a 1600-pixel-high print.  The black line at 3.3 marks Bill Claff’s PDR threshold (log base 2 of 10 is 3.3). The Claff PDR is measured by looking at where each curve crosses the black horizontal line. On the right side of the graph, the most important determinant of the SNR is the full well capacity (FWC) of the camera. On the left, the read noise comes into play. Higher is better. The top curve is for ISO 64, and the bottom one is for ISO 500.

In all cases, the signal to noise ratio for ISO 64 is better than for ISO 500. However, note that to get tot he right side of the IOS 64 curve will take 2.67 stops more exposure than that required to get to the same place on the ISO 500 curve.

For the visuals, I started with this subject:

ISO 64 EV 0
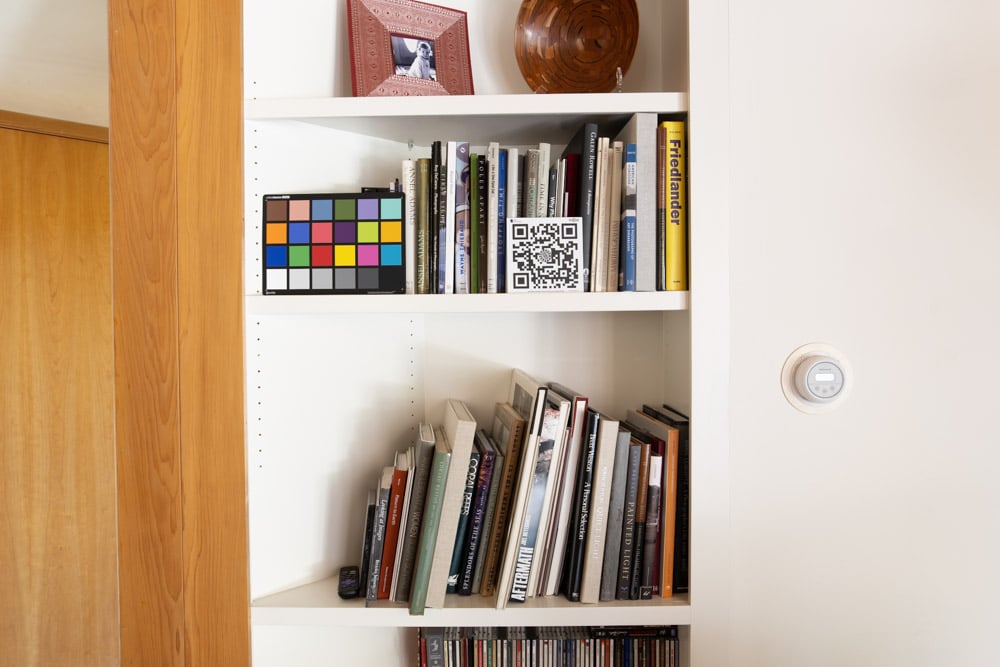
  • Z9 on Arca C1 on RRS legs
  • Sigma 24 mm f/1.4 lens set to f/8
  • Self timer
  • Exposure times for ETTR (EV 0) and some underexposures indicated by how many stops down from there

I developed the images in Lightroom with default settings except for the following:

  • White balanced to the second from the left gray patch on the Macbeth CC
  • No sharpening
  • No noise reduction
  • Exposure boost for the underexposed images in the amount of the underexposure

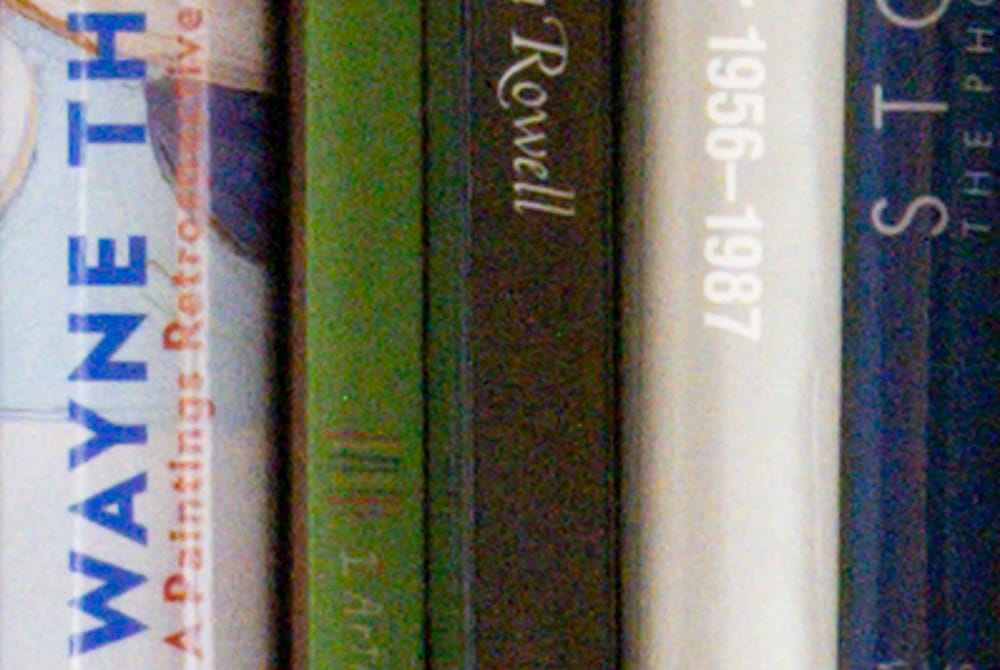
The next two images show fully-exposed (ETTRish) captures at somewhat more than 200% magnification.

ISO 64 EV 0


ISO 500 EV 0

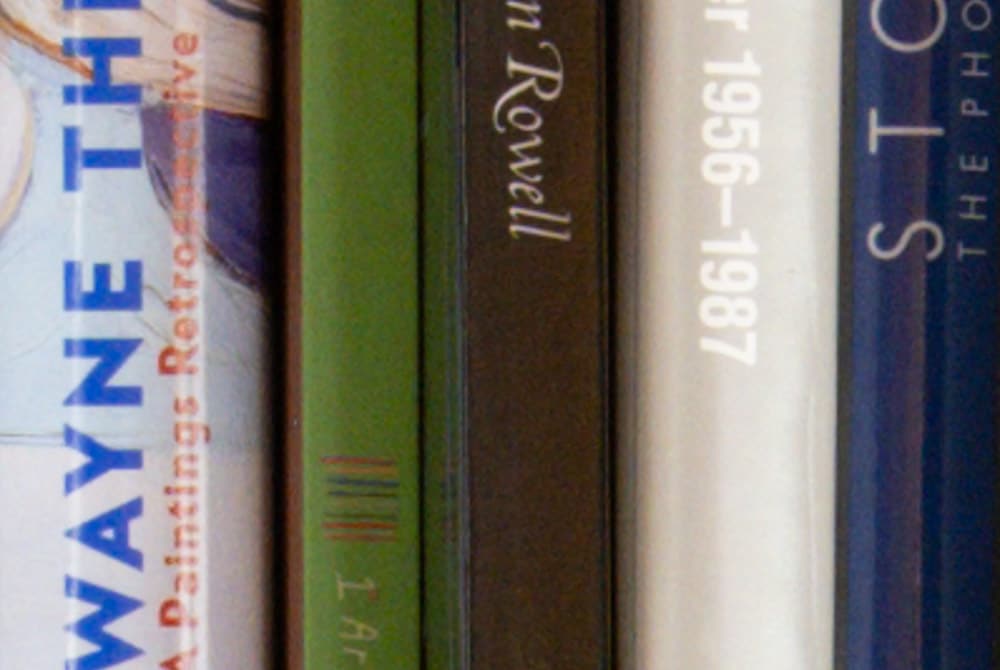
There’s not much difference. That’s because once the SNR gets above a certain point, it doesn’t make much visual difference.

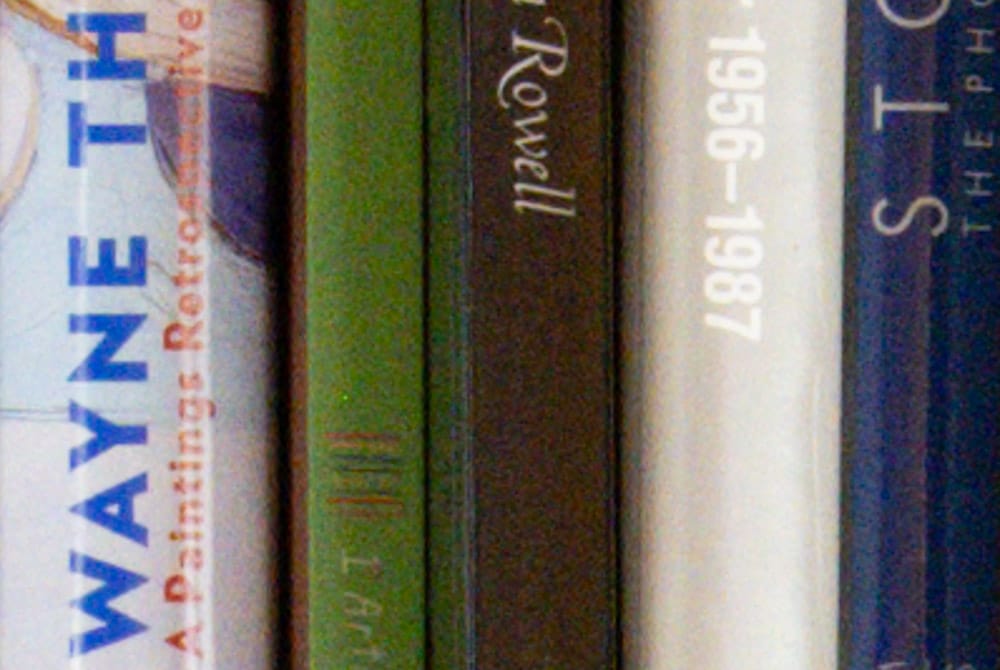
Compare the shot directly above with the one directly below, which was underexposed by 2.67 stops.

ISO 64, EV -2.67

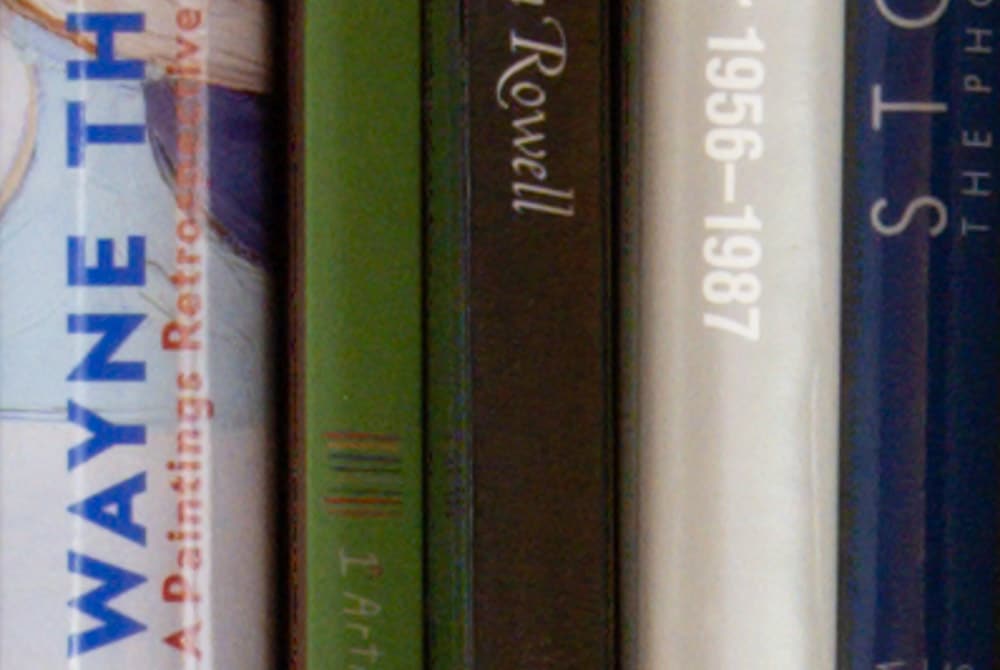
There’s still not much difference, which shows that with a camera with this much dynamic range, you can underexpose a lot and not suffer many consequences, if the image doesn’t need much shadow boosting

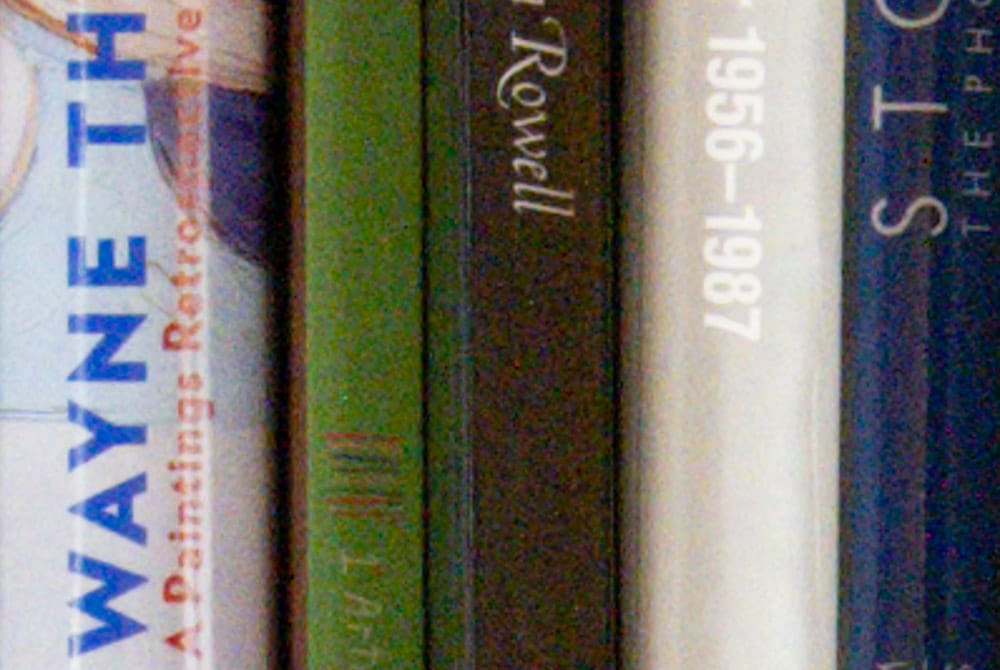
Now we’ll underexpose the ISO 64 image even further (5 stops!), and give the ISO 500 image the same exposure:

ISO 64, EV -5


ISO 500 EV-2.33

Now you can see that the ISO 500 image is noticeably less noisy.

What’s the difference between ISO 400 and ISO 500? Here are the PTC’s for those two ISOs:

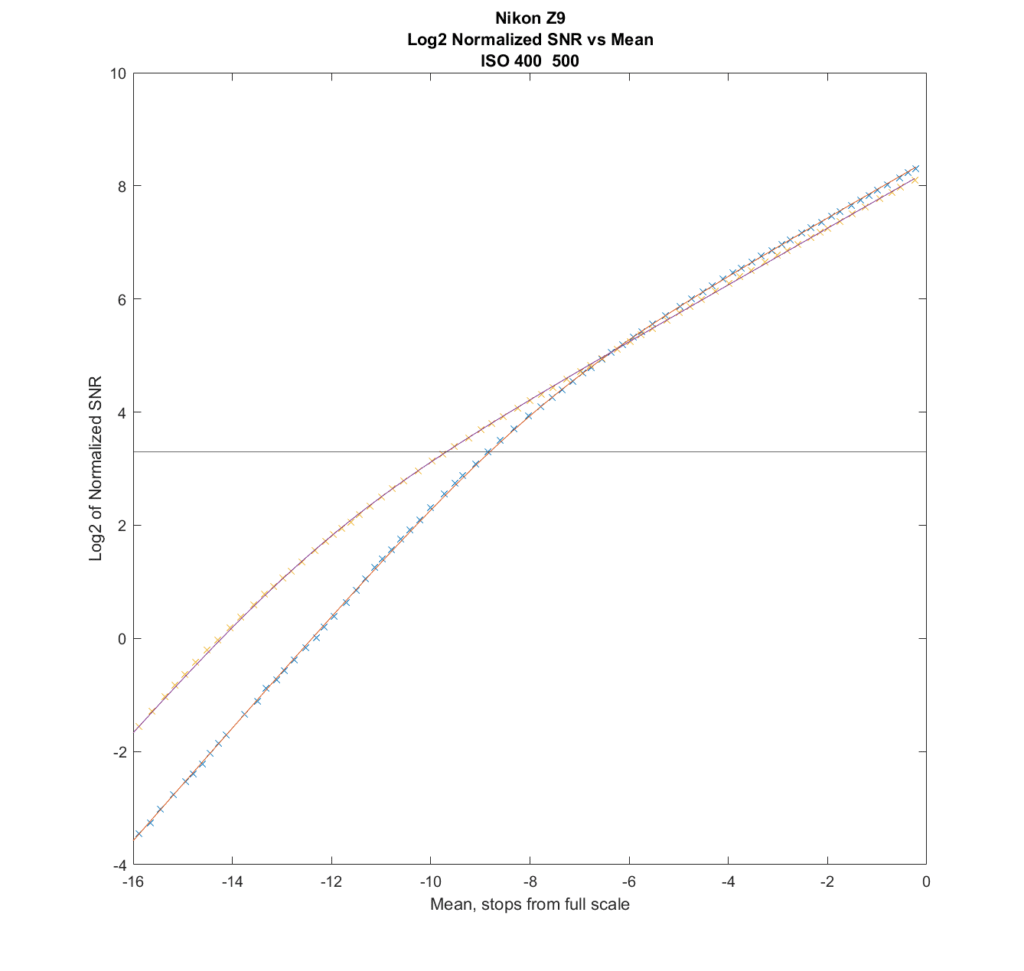
On the right, the top curve is the ISO 400 curve, and the bottom one is the ISO 500 curve. If you can give full exposure, ISO 400 is better until the signal level gets about 6 stops down from clipping, and worse below that. Note that I extended this curve into shadow levels useful only for forensic photography.

Here are two somewhat underexposed photographs whose dynamic range spans that 6-stop-down-from-clipping point. Although I can see no difference, the ISO 400 photo should have slightly less visible noise in the highlights. It should also have more visible noise in the shadows, and you can see that plainly.

ISO 400 EV -2.33


ISO 500 EV -2.67


Z9

← Nikon Z9 finder latency at 20 fps Smallrig L-bracket for Nikon Z9 →

Leave a Reply Cancel reply

Your email address will not be published. Required fields are marked *

May 2025
S M T W T F S
 123
45678910
11121314151617
18192021222324
25262728293031
« Apr    

Articles

  • About
    • Patents and papers about color
    • Who am I?
  • How to…
    • Backing up photographic images
    • How to change email providers
    • How to shoot slanted edge images for me
  • Lens screening testing
    • Equipment and Software
    • Examples
      • Bad and OK 200-600 at 600
      • Excellent 180-400 zoom
      • Fair 14-30mm zoom
      • Good 100-200 mm MF zoom
      • Good 100-400 zoom
      • Good 100mm lens on P1 P45+
      • Good 120mm MF lens
      • Good 18mm FF lens
      • Good 24-105 mm FF lens
      • Good 24-70 FF zoom
      • Good 35 mm FF lens
      • Good 35-70 MF lens
      • Good 60 mm lens on IQ3-100
      • Good 63 mm MF lens
      • Good 65 mm FF lens
      • Good 85 mm FF lens
      • Good and bad 25mm FF lenses
      • Good zoom at 24 mm
      • Marginal 18mm lens
      • Marginal 35mm FF lens
      • Mildly problematic 55 mm FF lens
      • OK 16-35mm zoom
      • OK 60mm lens on P1 P45+
      • OK Sony 600mm f/4
      • Pretty good 16-35 FF zoom
      • Pretty good 90mm FF lens
      • Problematic 400 mm FF lens
      • Tilted 20 mm f/1.8 FF lens
      • Tilted 30 mm MF lens
      • Tilted 50 mm FF lens
      • Two 15mm FF lenses
    • Found a problem – now what?
    • Goals for this test
    • Minimum target distances
      • MFT
      • APS-C
      • Full frame
      • Small medium format
    • Printable Siemens Star targets
    • Target size on sensor
      • MFT
      • APS-C
      • Full frame
      • Small medium format
    • Test instructions — postproduction
    • Test instructions — reading the images
    • Test instructions – capture
    • Theory of the test
    • What’s wrong with conventional lens screening?
  • Previsualization heresy
  • Privacy Policy
  • Recommended photographic web sites
  • Using in-camera histograms for ETTR
    • Acknowledgments
    • Why ETTR?
    • Normal in-camera histograms
    • Image processing for in-camera histograms
    • Making the in-camera histogram closely represent the raw histogram
    • Shortcuts to UniWB
    • Preparing for monitor-based UniWB
    • A one-step UniWB procedure
    • The math behind the one-step method
    • Iteration using Newton’s Method

Category List

Recent Comments

  • JimK on How Sensor Noise Scales with Exposure Time
  • Štěpán Kaňa on Calculating reach for wildlife photography
  • Štěpán Kaňa on How Sensor Noise Scales with Exposure Time
  • JimK on Calculating reach for wildlife photography
  • Geofrey on Calculating reach for wildlife photography
  • JimK on Calculating reach for wildlife photography
  • Geofrey on Calculating reach for wildlife photography
  • Javier Sanchez on The 16-Bit Fallacy: Why More Isn’t Always Better in Medium Format Cameras
  • Mike MacDonald on Your photograph looks like a painting?
  • Mike MacDonald on Your photograph looks like a painting?

Archives

Copyright © 2025 · Daily Dish Pro On Genesis Framework · WordPress · Log in

Unless otherwise noted, all images copyright Jim Kasson.