Today I turn the read noise analysis tools developed over the past couple of weeks to a new camera, the Leica M240. The M240 is one of those cameras that subtracts out the black point before it writes the raw file, so we won’t get a clear picture of the read noise from a dark-field exposure. We know from previous experience that the M240 is over-enthusiastic in its subtraction below ISO 1000, resulting in the “green shadows” problem. As we will see, there’s a method to Leica’s madness; the subtraction reduces low-frequency read noise in the dark-field images, making the camera test better. However, that doesn’t help photographers trying to make real images, since a little light falling on the sensor is enough to reveal the underlying read noise in all its ugliness. So there really is no benefit to the in-camera processing that brings us the green shadows.
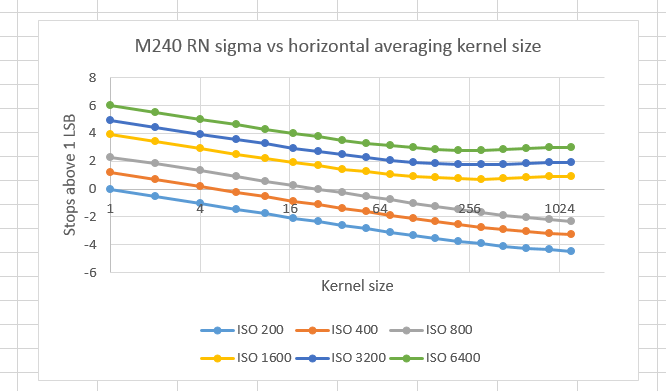
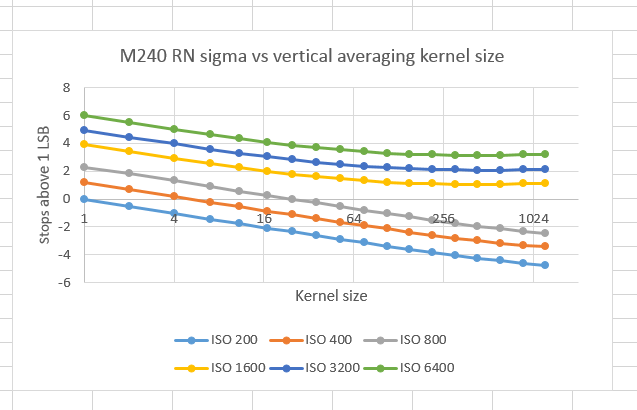
Here are curves with one-dimensional averaging with various kernel sizes in both the horizontal and vertical directions:
The vertical and horizontal curves are very similar. ISOs 200, 400, and 800 enjoy the benefit of the aggressive black point selection.
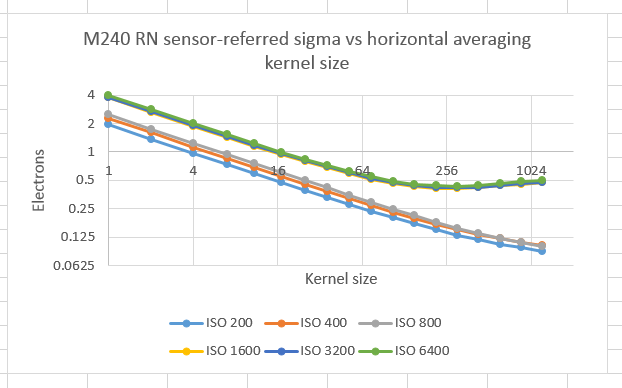
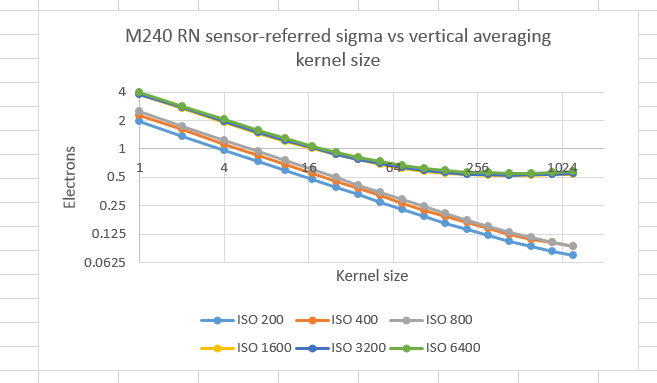
We can look at the curves referenced to the input side of the pre-ADC amplification:
Note that the read noise numbers are much smaller than you’ve seen elsewhere. That’s because, thanks to Leica’s raw processing, we’re not seeing all the real read noise; it’s being cut off on the left side of the histogram. You should double the read noise for ISOs of 1600 and above to get an estimate of the real number, and ISOs below that will need even greater compensation. ISOs 1600, 3200, and 6400 are right on top of each other, indicating that the camera is “ISOless” through this range.
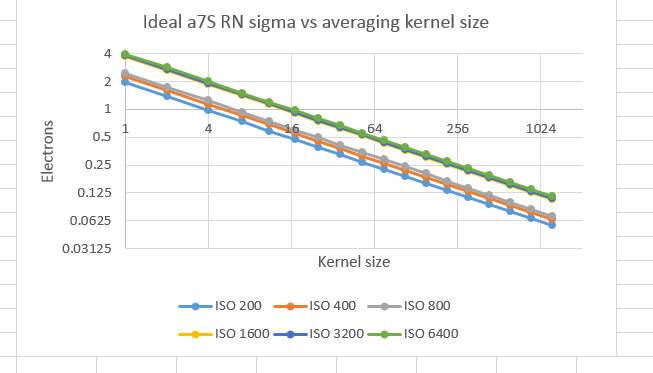
If the M240 read noise were white Gaussian noise, the above two graphs would look like this:
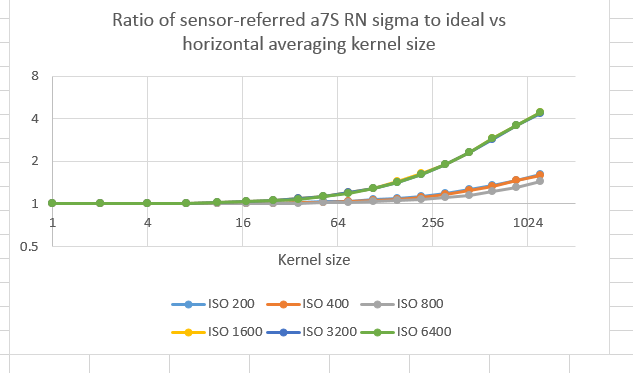
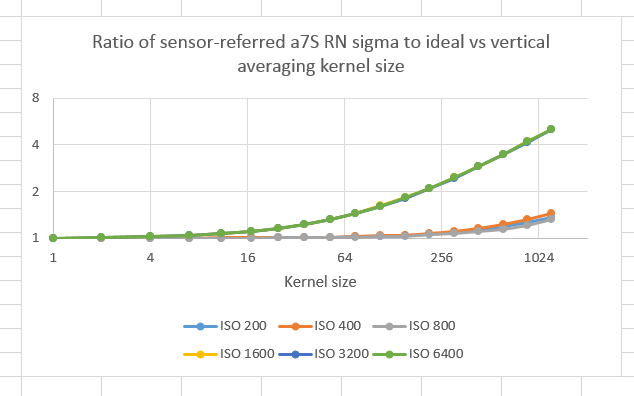
If we normalize the two sensor-referred graphs to the ideal, white-noise case, we get these two plots:
I suggest ignoring the curves for ISOs 200, 400, and 800; they’d probably look like the other ones if Leica didn’t do its black point trick at those ISOs. The other curves are on the good side of what we’re now starting to recognize as typical low-frequency performance. It is commendable that there is littl difference between the horizontal and vertical numbers.
Next up: pictures.
Leave a Reply