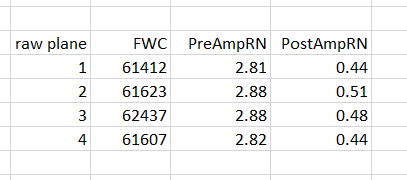
Now that I’ve taught DCRAW and my Matlab analysis program to be on the same page with the a7II files, I set about to find the read noise (RN) and the full well capacity (FWC) of the camera across a range of ISOs. I told the modeling program to consider all ISOs from 100 to 6400 in one-third stop steps as a group, and to throw away all samples where the green channel signal-to-noise ratio (SNR) was less than 2. I did the calcs separately for each raw channel. Here’s the answer:
There is much greater consistently across the channels than with the two Nikons I’ve tested so far, the D4 and D810. That makes me even more suspicious of the Nikon digital white balance scaling as the culprit in the case of those cameras.
In the table above, we separate the read noise into two components, as described earlier. The first is the read noise on the sensor side of the amplifier whose gain is controlled by the ISO knob; that’s the pre-amp read noise, and its units are electrons. The second is the read noise on the ADC side of the amplifier. I call that the post-amp read noise, and its units are ADC LSBs. Let me explain that last unit a bit. Yes, the post-amp read noise is an analog quantity, and we could measure it in volts — actually microvolts — but that wouldn’t mean much to us as photographers. We care about how it makes the digitized result uncertain, and thus it is natural to measure it in the units that we see when we look at the raw files.
You will note that the post-amp RN for the a7II is about one-fourth as high as for the Nikon D4. That’s because the D4 is a 14-bit camera, and one LSB is a quarter of the Sony’s LSB, measured as a ratio to full scale. Measured in percent of full scale, the a7II and D4 post-amp RN are about the same.
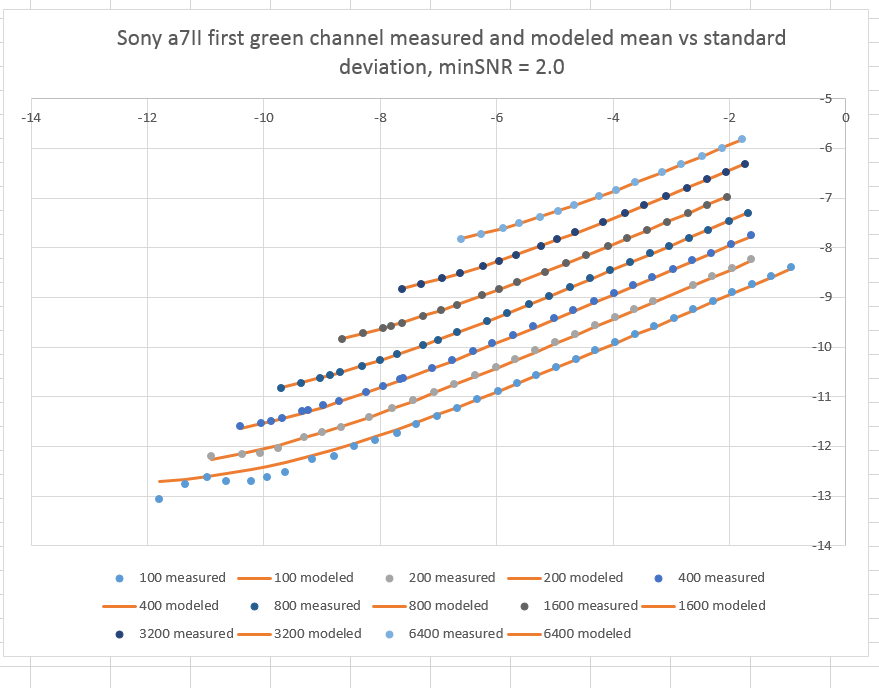
How well do the above model parameters fit the measured data? Pretty well. Here’s the standard deviation of the measured (the blue dots) and modeled (the orange lines) standard deviation (sigma) versus the mean value (mu). Both are plotted as stops below full scale.
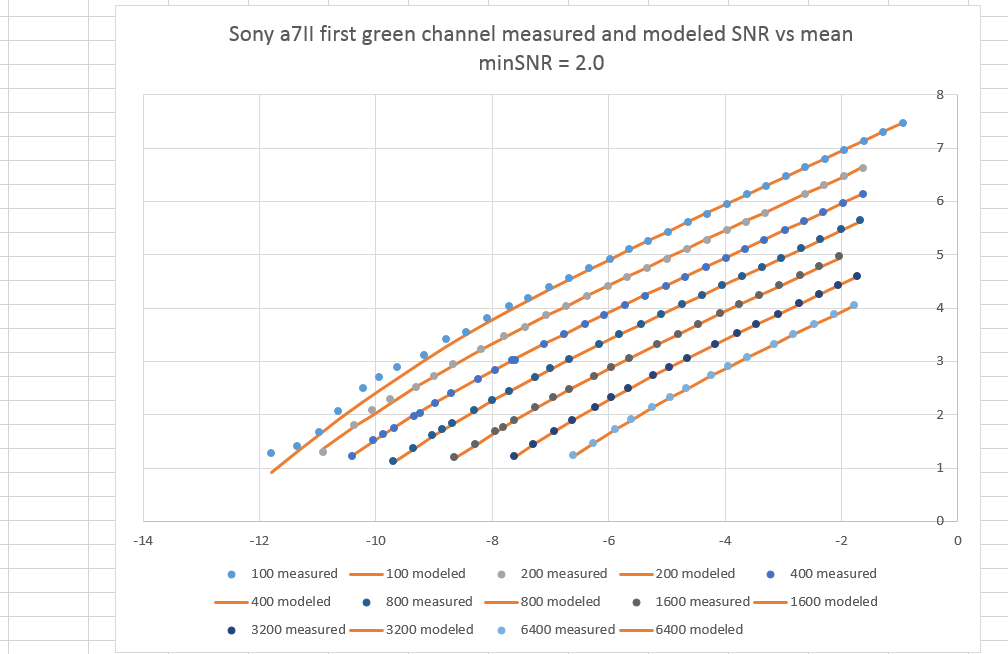
If you would prefer to see the same data in terms of DNR, I will oblige:
Although the model was fitted to all the ISOs in the range, I’ve only plotted the whole-stop ones to keep the graph understandable.
All but the lowest ISO modeled data in the darkest tones fit the measured data quite well.
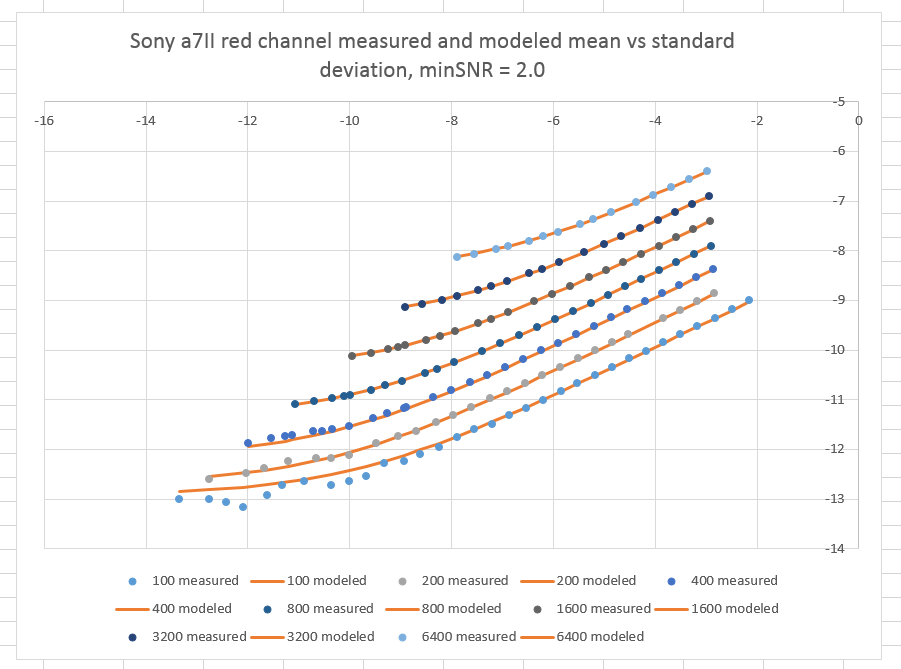
If we look at the red channel sigma vs mu, here’s what we see:
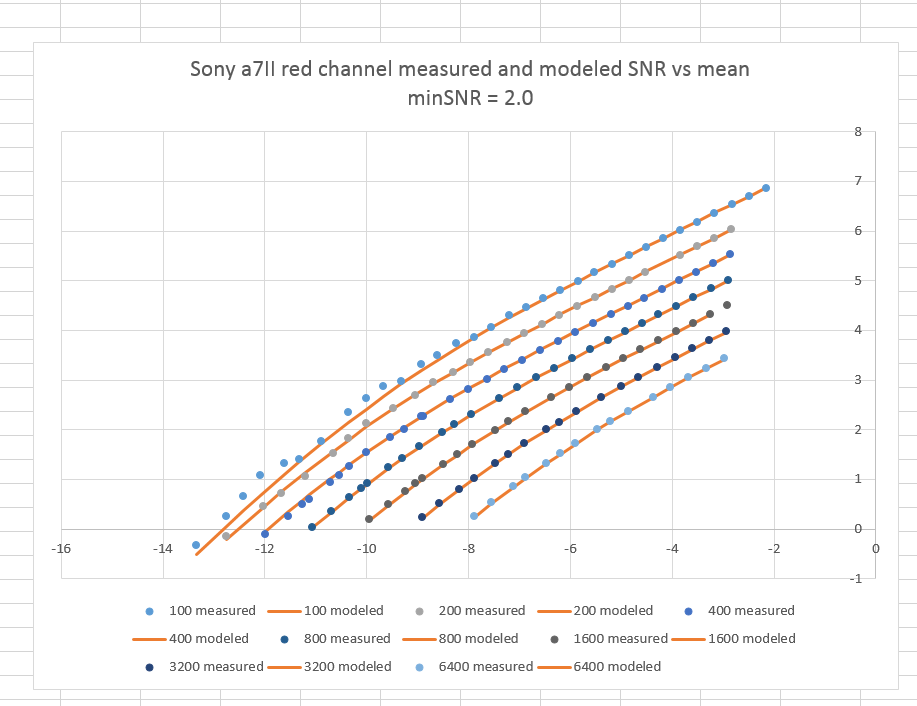
And the red channel SNR vs mu:
Again, all but the lowest ISO modeled data in the darker tones fit the measured data well. The fact that the classical model fits the actual data well means that it is unlikely that the camera will need any special treatment to get the best out of it.
Leave a Reply