I haven’t posted for a while because I’ve been working on better ways to present the data that I’ve collected on focus accuracy for the a7RIII, the D850, and the GFX with various lenses.
I’ve decided that I should make the following changes to my default graphs:
- Present more test cases on a single graph
- Present luminance data only
- Present circle of confusion (CoC) data only
- Present the mean, mean-plus-sigma, and mean-minus-sigma data only, and drop the display of the individual sample points, which get confusing due to the first change
- Standardize on only two vertical axis scales. One would be better, but the data is too disparate for that to work well.
Here’s an example:
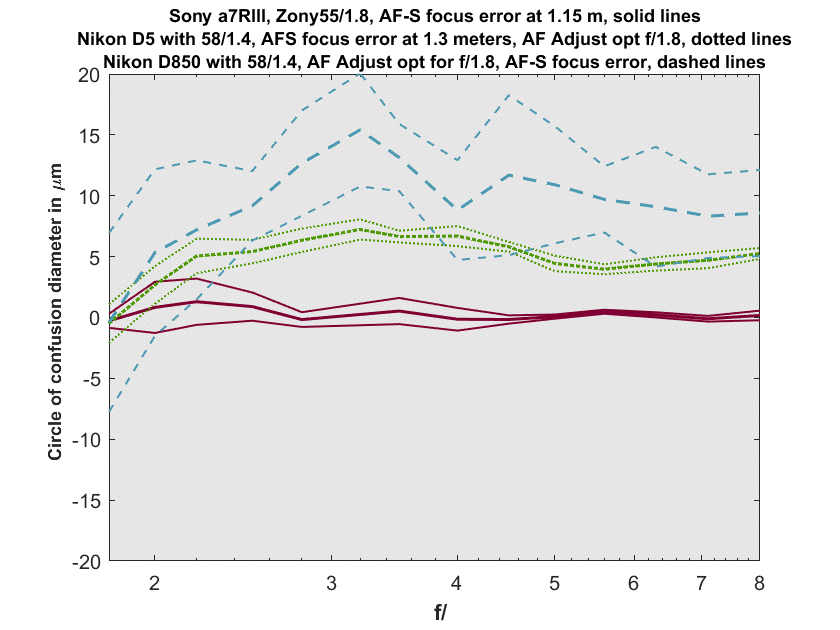
The above graph plots the AF-S performance of the D5, the D850, and the a7RIII with “normal” lenses over the range of apertures from f/1.8 through f/8. The D850 and the D5 were focused using phase-detect autofocus (PDAF). For the two Nikons, the AF adjustment was optimized for f/1.8 at the target distance, so both cameras are shown in a way that does not disadvantage them because they are not using on-sensor focusing systems. The vertical axis is the diameter of the misfocus-induced CoC in micrometers. The heavier lines are the mean of the 10 samples per aperture per camera. The lighter lines are the mean-plus-sigma, and mean-minus-sigma data (Sigma is shorthand for standard deviation).
My takeaways from the above graph are the following:
- The spread of the data in D5 and a7RIII cases are about the same.
- The D5 looks like it is to some extent correcting for the focus shift of the Nikon 58/1.4.
- The D850 is not correcting for that focus shift.
- The D850 data spread is uncomfortably large for a camera with a pixel pitch of about 4.3 micrometers.
- The a7rIII results are excellent.
- The D5 results are adequate.
- The D850 results are disappointing.
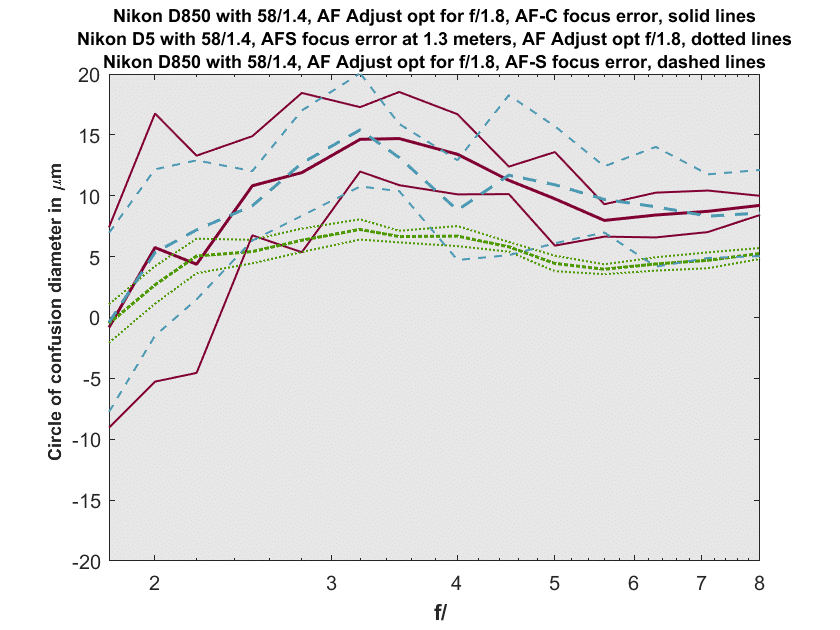
- As you can see by the graph below, switching the D850 to AF-C doesn’t make things much different at wide apertures, but reduces the spread a bit at narrow ones.
Are there ways to improve the performance of the D850? Indeed there are.
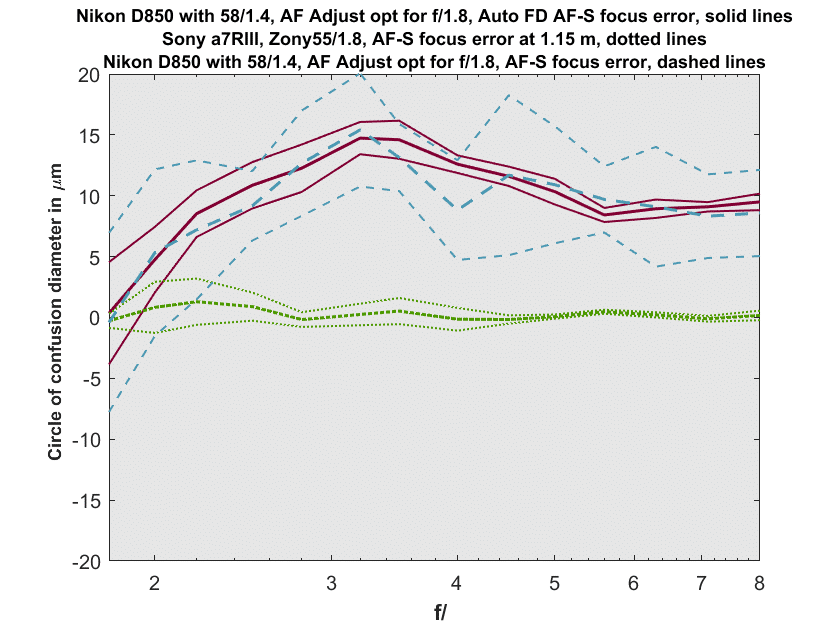
By allowing the D850 to select more focus points, the spread in the data can be reduced. Of course, the focus shift of the lens means that the mean performance is about the same.
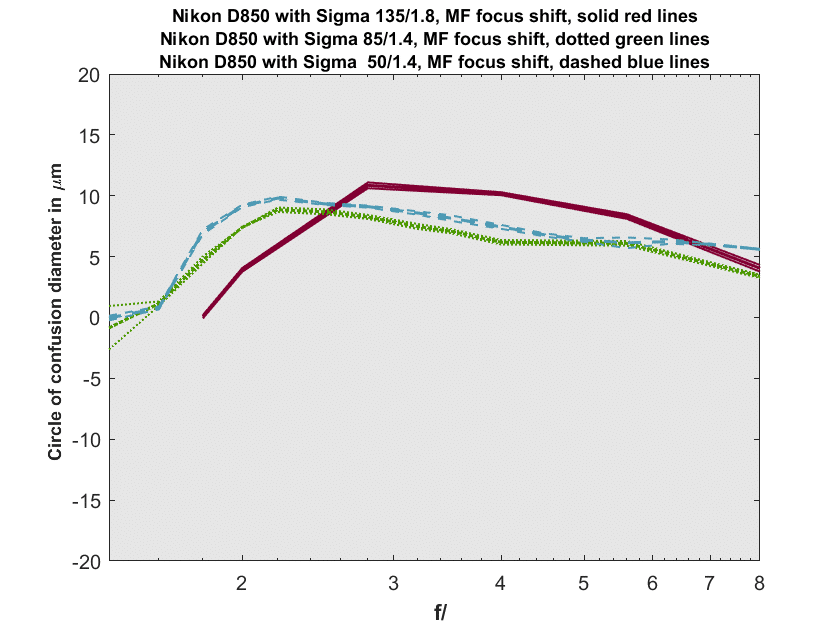
Now let us turn our attention to focus shift, concentrating on the D850.
The Sigma 50, 85, and 135 Art lenses all have about the same amount of focus shift, and that amount is moderate:
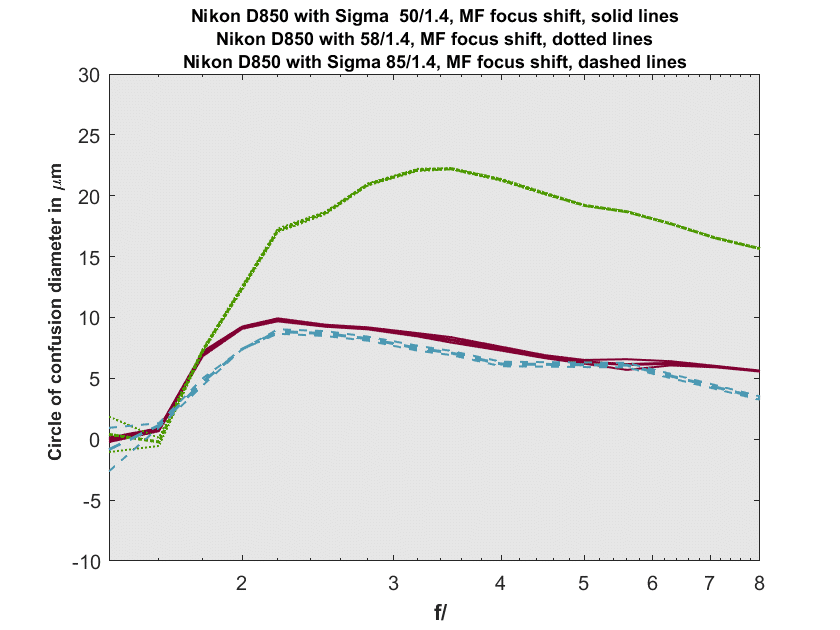
But the Nikon 58/1.4 (green lines below) has so much focus shift that I had to shift the vertical axis to get the curves in:
Focusing the 58/1.4 wide open and stopping down past f/2 will give clearly unacceptable results.
I will be revisiting some more of the data I’ve been collecting and summarizing it with graphs like these.
Very nice, clear presentation Jim, the Sony’s AF sure looks in a class of its own for these still captures. What do you think about fine tuning the Nikons at a more ‘normal’ reference of f/2.8?
Many thanks! Very clear presentation with all data relevant to me available.
Maybe I’m being thick, but what is Auto FD AF-S? Is it Group-area AF, Auto-area AF, or something else I’ve missed?
And with respect to the D850 AF-C data, is that single-point or one of the multi-point options?
I know you’re reluctant to speculate, but can you imagine why the focus errors with AF-C are smaller with smaller exposure apertures? The diaphragm stays open during AF-C no matter the aperture selected for exposure.
Auto FD AF-S = Auto-area AF with FD confirmation received for each shot. AF-C and AF-S unless noted is single spot.
As the aperture gets narrower, the CoC for a given focus error in micrometers gets smaller.