This is the tenth in a series of posts on the Sony a9. The series starts here.
Warning: this is a techie post about esoteric aspects of camera sensor analysis and modeling. There is not much to learn here that would apply to general photography. If you aren’t interested in these things for their own sake, do yourself a favor and skip this one.
Anybody left? Thanks to both of you.
Bill Claff remarked that there appeared to be a kink in the Sony a9 read noise vs ISO setting curves that affected the bottom three stops in the high-conversion-gain and the low-conversion-gain ranges — ISO 640 — 1250, and ISO 100 -200, respectively. He uses different methods, and obtains slightly different results, but here’s what he’s talking about with my data and modeling techniques:
This is the read noise of the a9 that I tested expressed in counts, or LSBs, or DNs (take your pick). I think you can see the kinks. The curves are flatter in the two regions that Bill pointed out.
Looking at the ISO 100 to 500 part of the curve more closely:
Bill thought that this might be due to the a9’s ADCs not acting completely like 14-bit ones, but having some of the characteristics of 12 bit converters, even though the histograms look like you’d expect the histograms from 14 bit ADCs to look. I was unconvinced. It appeared to me that the a9 had enough — barely enough, but enough — read noise to properly dither even a 12-bit ADC.
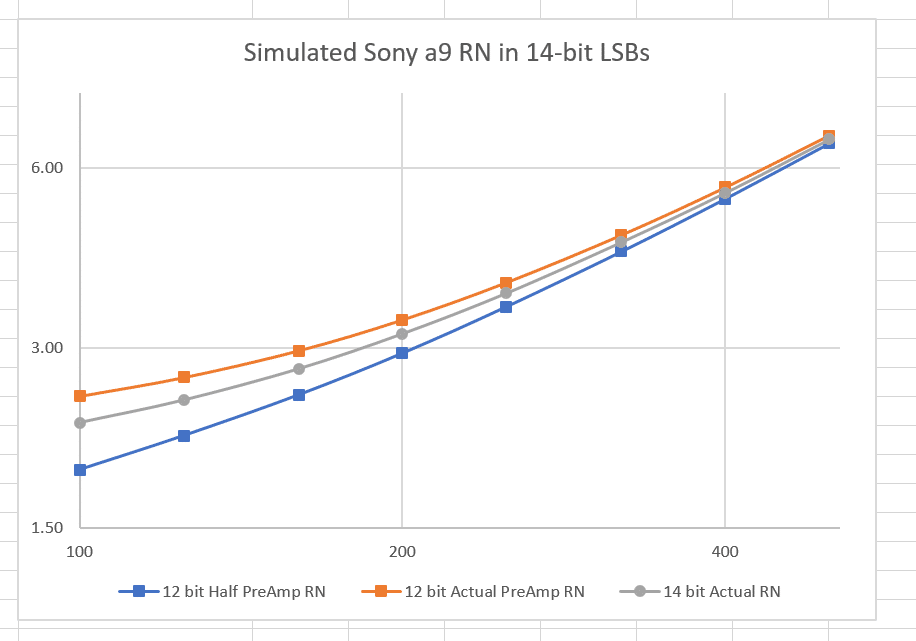
I happen to have a camera simulator integrated with my analysis and modeling software that I developed to test the program. I ran three cases
- 14-bit ADC with the modeled RN of the a9 over the ISO range 100-500
- 12-bit ADC with that same noise
- 12-bit ADC with half the preAmp noise
I know that’s confusing, but if I show you some details, I think it will make sense.
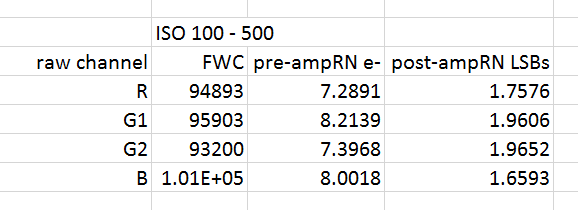
Here are the modeled values for the a9 in that ISO range:
The unity-gain ISO (the ISO setting that produces one count at the ADC output for one electron on the sensor) is about 600. To get the read noise in counts, Start with the ISO setting. Divide it by the Unity gain ISO to get the gain in counts per electron. Multiply that by the pre-Amp RN above. Add that in quadrature (square root of the sum of the squares) to the post-Amp RN. I put all those values into my camera simulator, had it produce a set of output images, analysed those images, and calculated the read noise as a function of ISo setting. Then I did the same thing with 12-bit simulated ADCs and the same noise — actually, to make it apples and apples, I had to divide the post-Amp RN by 4 since the LSBs of the 12-bit ADC are paced four times the voltage of thos e of a 14-bit ADC. Then I divided the post-Amp RN in half again and ran the sim. That gave me three sets of numbers:
You can see that the 12-bit results with the same amount of RN — the orange curve — has more flattening at low ISOs, since the quantizing noise is higher. If we lower the post-Amp Rn by a factor of two, the 12-bit curve doesn’t flatten much.
Now let’s look at the photon transfer curves to see if the ADC is being properly dithered.
With a 12-bit ADC and the same amount of RN:
The modeled and measured are right on top of each other. That looks like good dithering.
With half the RN:
Now we can see rippling. Let’s look closer. With the same amount of RN as the real a9:
With half the post-amp RN:
If you want to see some real 12-bit PTCs that look like this, have a look here.
My conclusions are that we need to look elsewhere for the a9 kinks. But I’m willing to listen to counterarguments.


Horshack says
Jim, the kinks between ISO 100-200 on the A9 look very similar to those on the D4 and D4s, all of which purportedly share an Aptina dual-conversion design. I realize the A9’s conversion gain switch-over occurs much later than the D4/D4s (ISO 600 vs 200), but perhaps there are more than two levels of conversion gains on the A9 design.
Here’s a graph I plotted on Bill’s site comparing the A9 vs D4/D4s. I included the A7rII as control:
https://photos.smugmug.com/photos/i-pk55Vcf/0/7fc5334f/X3/i-pk55Vcf-X3.png
JimK says
Thanks for that. I don’t see the same kind of jump at low ISOs as I do at the 500 to 640 transition. And it looks like the change at 640 is consitant with what you’d see with an increase in conversion gain of 6.4, not 3.2, but, admittedly, I haven’t run tests aimed at measuring that.