
In the previous post I looked at lots of ways to display histograms. In this one, I’m going to take a scene with normal outdoor contrast, and look at the relevant histograms. Here’s the scene, as captured by a Hasselblad X2D with a 90 mm XCD lens, at close to ETTR (more on that later),… [Read More]
Archives for May 2023
A deep dive into histograms
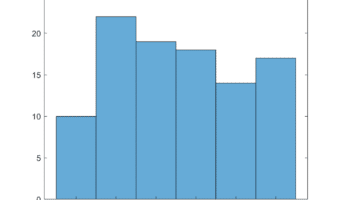
Around the turn of the 20th century, Karl Pearson, an English mathematician and statistician, invented the histogram as a way of presenting data. Originally, the histogram was a kind of bar chart, with the x-axis divided into intervals — now called buckets or bins — and a bar for each bin indicating how many items… [Read More]