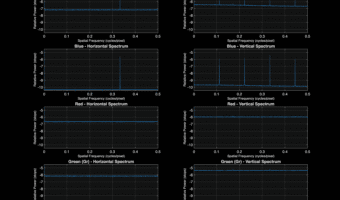
I’ve been looking for a better way to present read noise spectra, and I think I’ve found one. These graphs present the average horizontal spectra of each of the four raw channels, one ISO setting per eight-panel plot set. The reference level is preserved across the graphs, so that you can see the ensemble increase… [Read More]