To a first approximation, the modulation transfer function (MTF) curve for a given lens and a given sensor is the product of the MTF curve for the lens alone times the MTF for the sensor alone. But how do you measure the MTF of a sensor with a perfect lens?
You don’t. You simulate it.
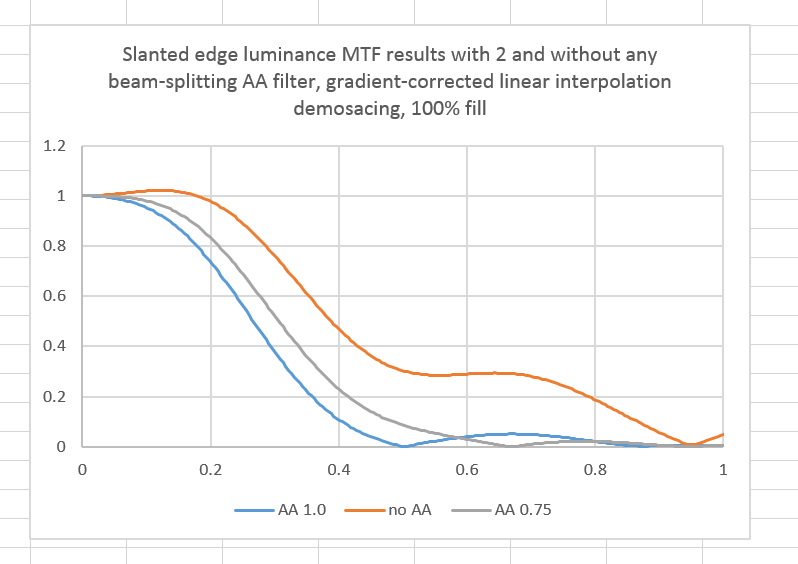
Here’s a set of curves that you might multiply your lens curves by to see what the overall effect might be. This is from a simulation that I wrote, for a perfect — contact printing — lens on a sensor with 100% fill factor.
Details of the sim:
- Adobe RGB RGGB CFA
- 16:1 optical scaling
- Diffraction = 0
- Gradient-corrected linear interpolation
- RGB image converted to luminance before running SFR code
- Burns’ sftmat3 used to compute MTF
The horizontal axis in in cycles/pixel. The Nyquist frequency is 0.5 cy/px. Two different AA filter are simulated, both of the four-way beam splitting variety. One has a zero at the Nyquist frequency, and one at just below 0.7 cy/px. The bounce at the far right for the no-AA filter curve and the rise above unity on the left of that curve are probably because the optical processing to sampling ratio was too small, but the anomalies could be because of a lack of sophistication in sfrmat3.
You can see that, for a sharp (in this case, very sharp) lens and a high-spatial frequency subject, sizable reduction in aliasing is obtained at some loss in sub-Nyquist contrast.
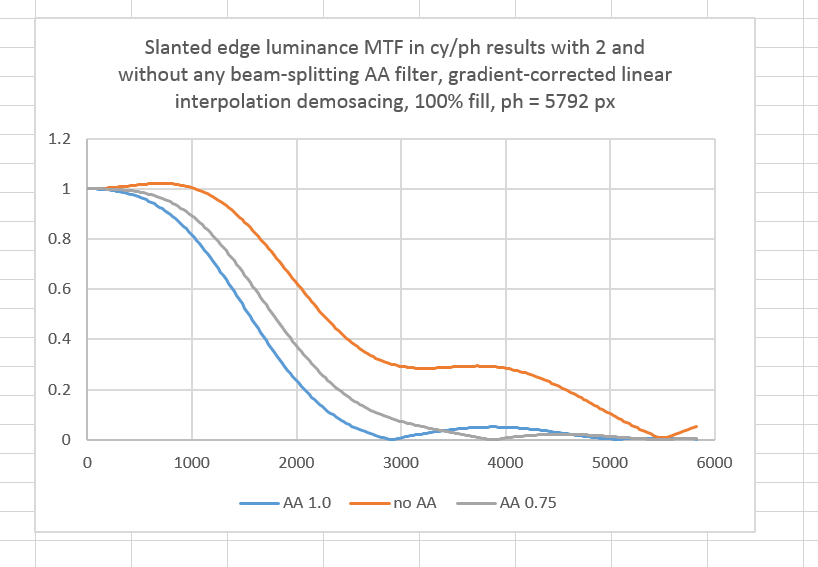
If you’re used to seeing MTF curves in cycles per picture height instead of cycles per pixel, here’s one for a camera with a 5792 pixel sensor height.
It would be nice if lens vendors would publish MTF curves in this form. Then it would be pretty easy to see how a given lens would perform on any particular camera.
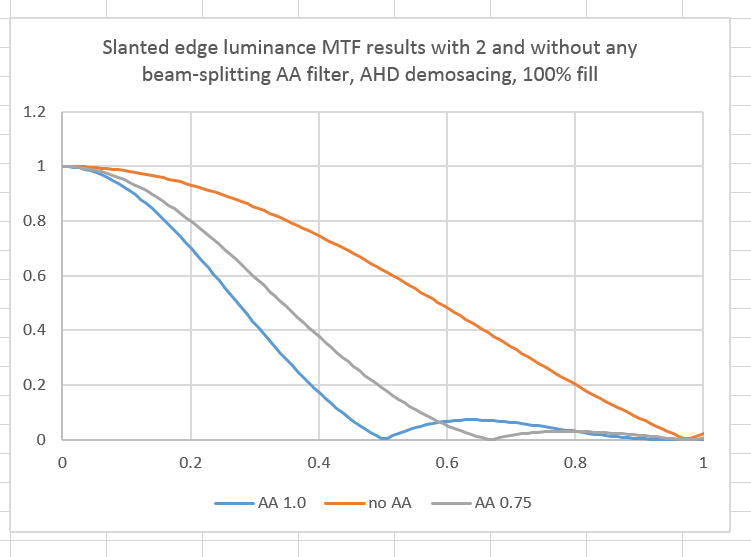
If we use AHD demosaicing, things look quite different:
The AA filter is costing us more sharpness, and gaining us more removal of frequencies subject to aliasing.


Leave a Reply