This is a continuation of a series of posts on the Sony a7RIII. You should be able to find all the posts about that camera in the Category List on the right sidebar, below the Articles widget. There’s a drop-down menu there that you can use to get to all the posts in this series. You can also click on the “a7RIII” link in the “You are here” line at the top of this page.
You’ve had a break from graphs, but it’s over. Not a single qualitative visual in this post. Sorry.
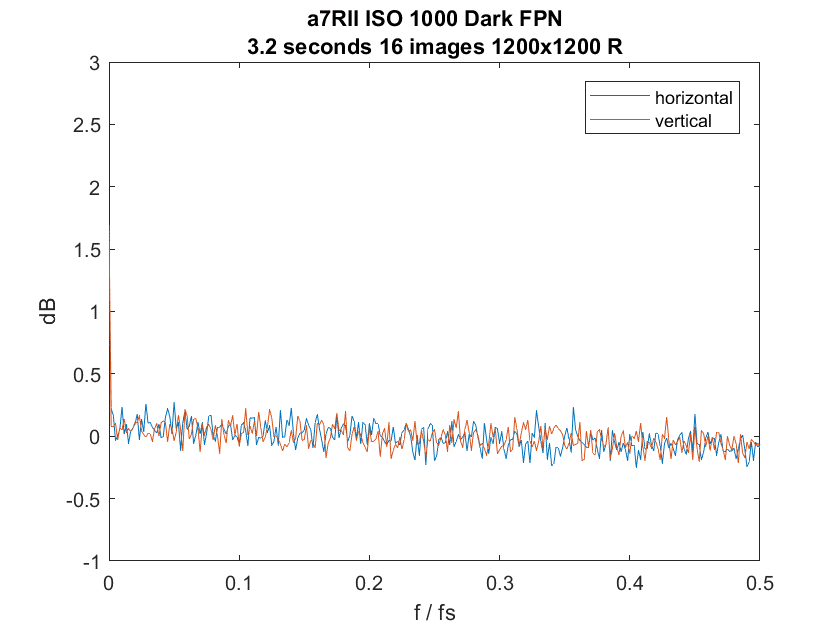
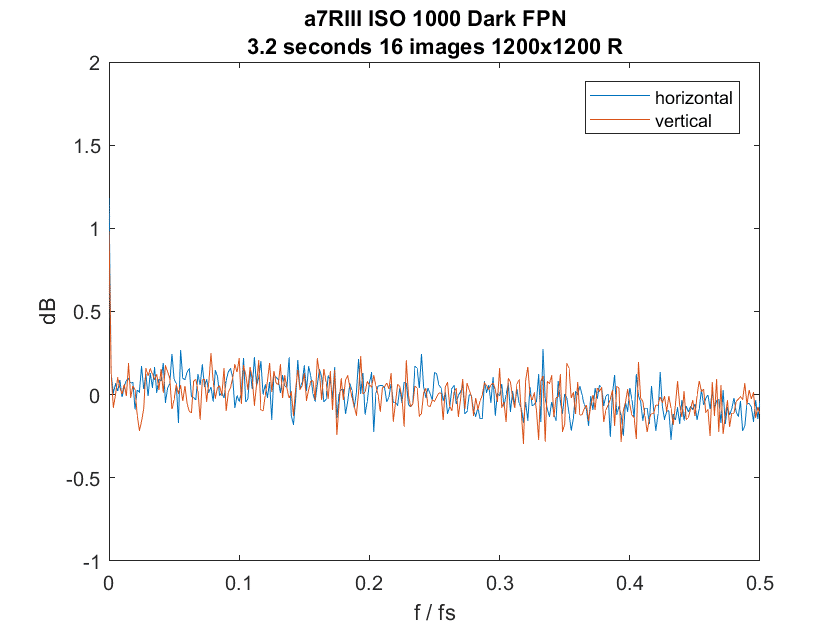
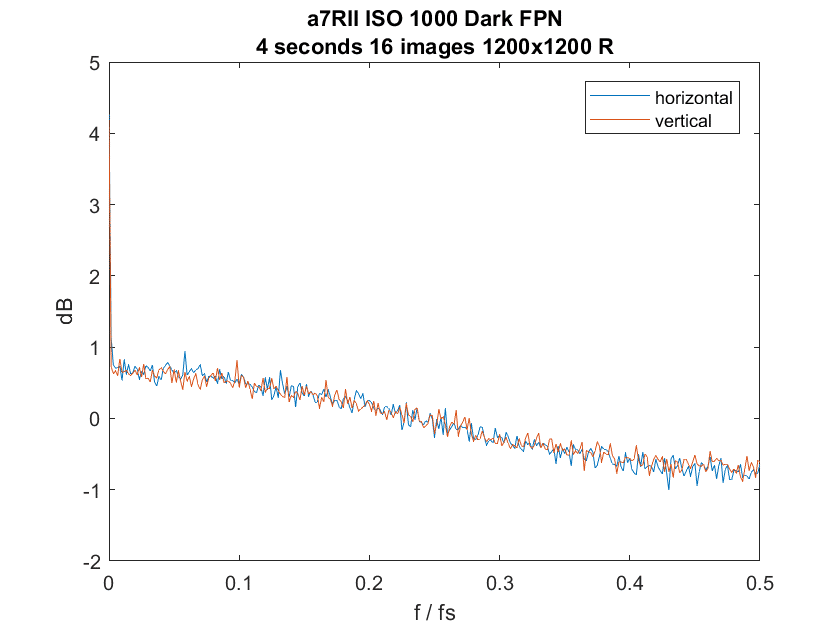
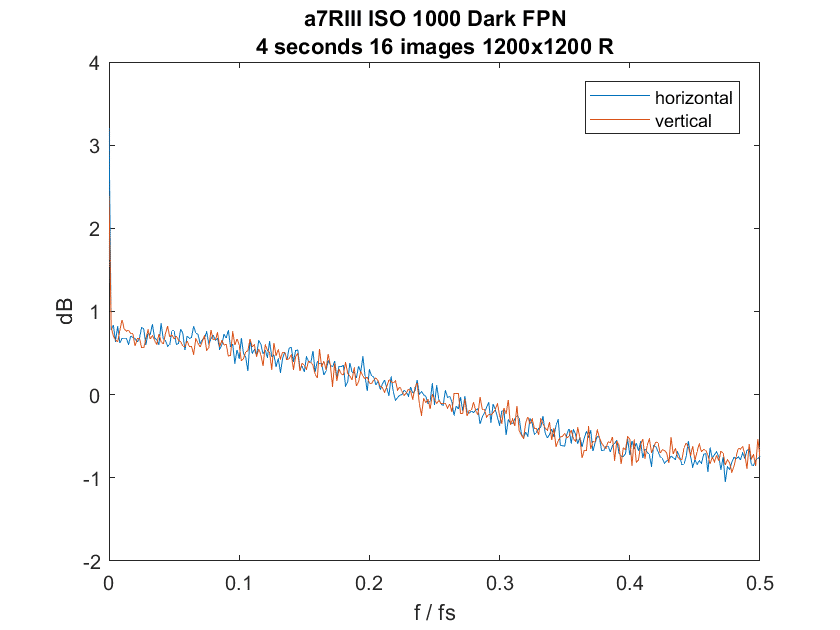
When I was working on analyzing the “star eater” image filtering of the a7RIII earlier in this series, I made a series of 16 3.2-second dark-field uncompressed exposures at ISO 1000, and another at 4 seconds, which is where the stars start to be munched. I did that with the a7RIII and, for comparison, the a7RII. Today I went back to those images, averaged each of the sets, cropped out 1200×1200 central sections of each raw plane, and looked at the frequency response, hoping that I might see some differences between the way the 4-second exposures are processing with the two cameras.
Here’s the red channel at 3.2 seconds with the old camera:
And the new one:
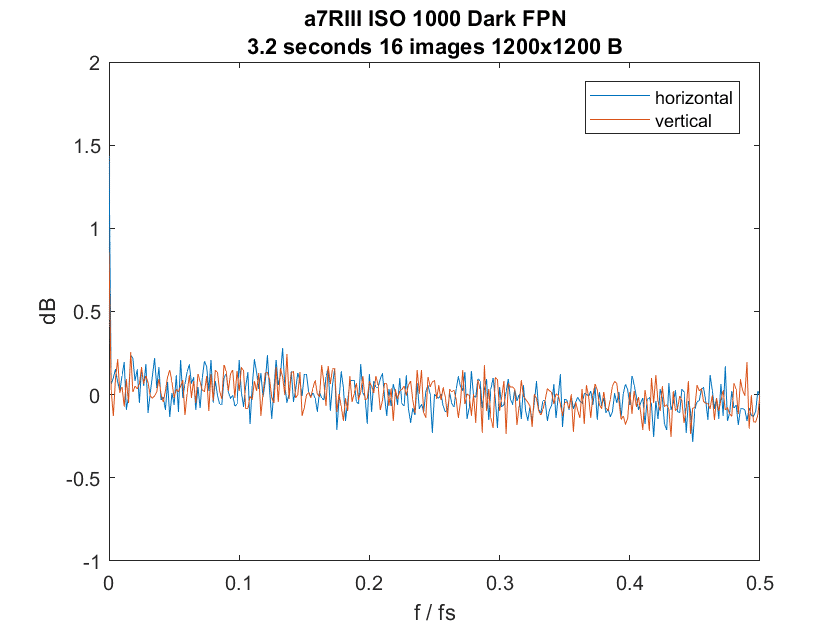
These graphs, and all the others you’ll see in this post, have the vertical axis auto-scaled. The upper limit is usually set by the very low-spatial-frequency value and is an indication of the amount of low-frequency pattern noise. The rightmost point on the horizontal axis is half the sampling frequency (fs) which is the Nyquist frequency. The filtering doesn’t appear to be much different, but there is more low-frequency noise in the a7RII image. Right about now, you’re probably wondering about the temperatures of the two cameras when these exposure sequences were made. 28 degrees C for the a7RIII, and 24 degrees for the a7RII.
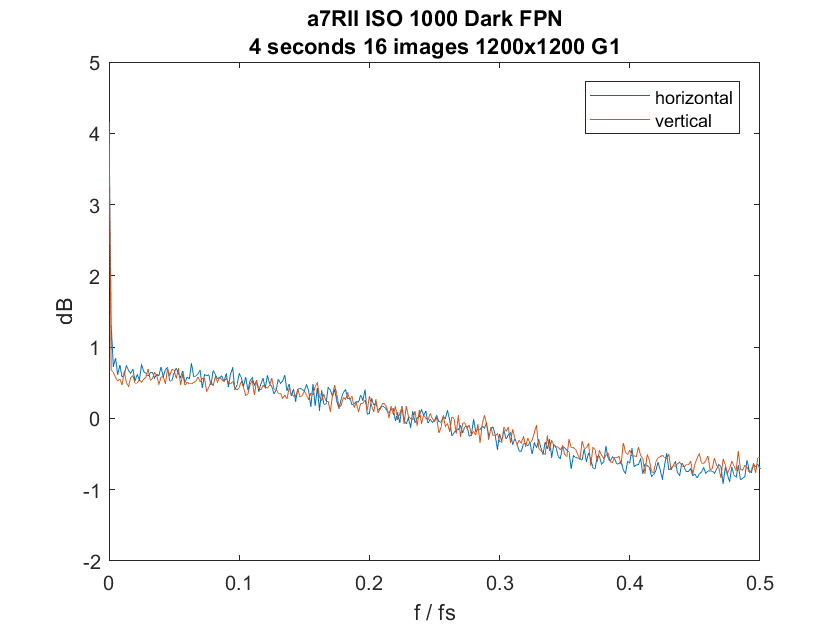
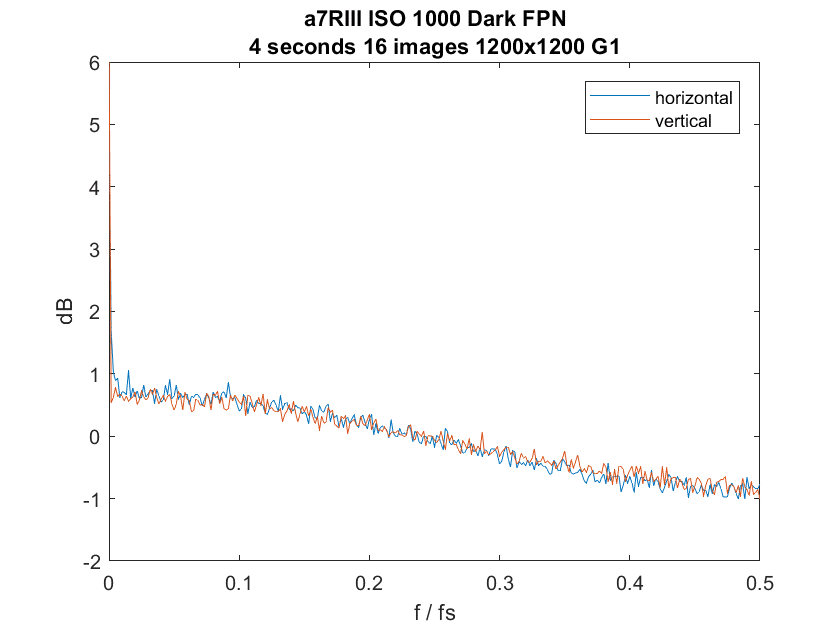
Now the same channels at 4 seconds exposure:
These responses are essentially identical except for higher low-frequency noise in the a7RII shots. The star-eater processing is apparent.
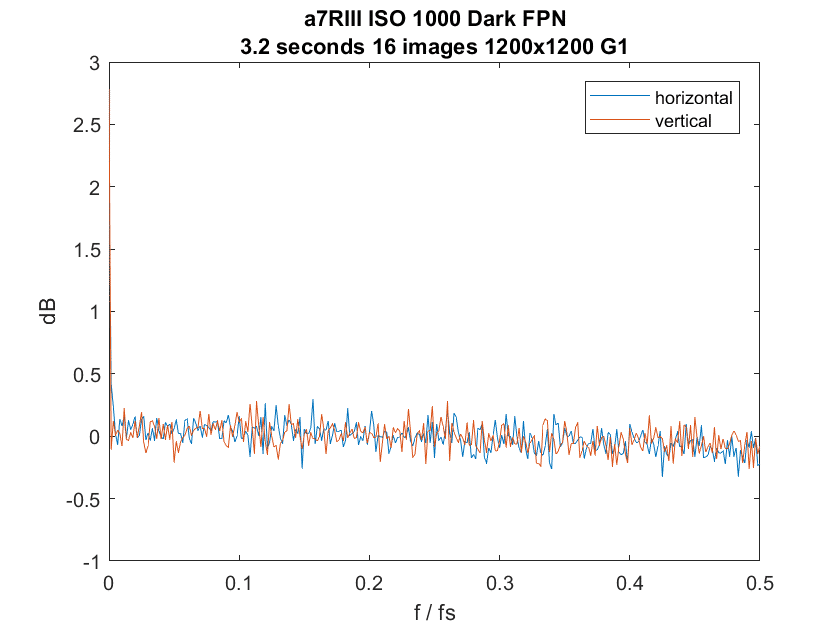
Now the G1 channel, the green channel that is in the same row as the red one:
Now the a7RII has less low-frequency noise. Otherwise the responses are flat.
The a7RIII has slightly more LF noise.
The G2 channels are similar to the G1 ones, so I’ll spare you the repitition.
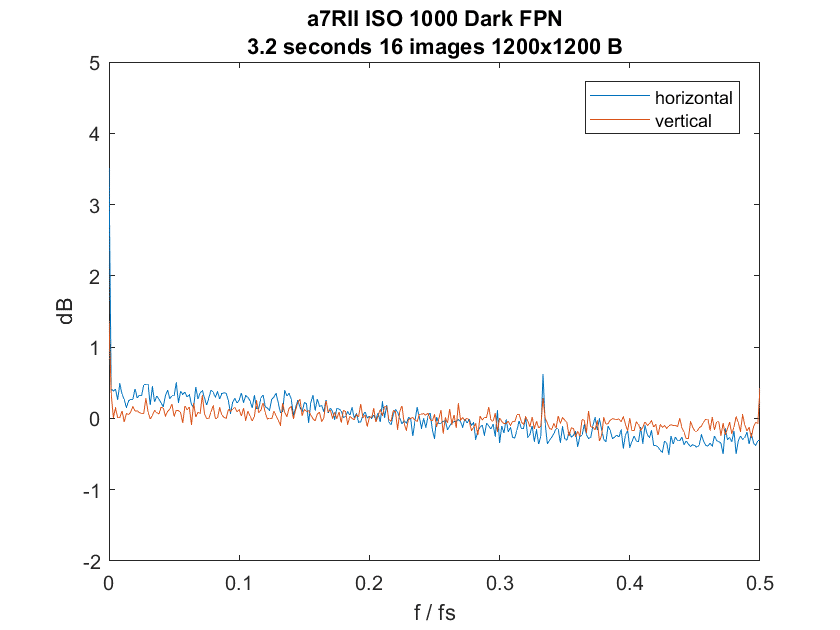
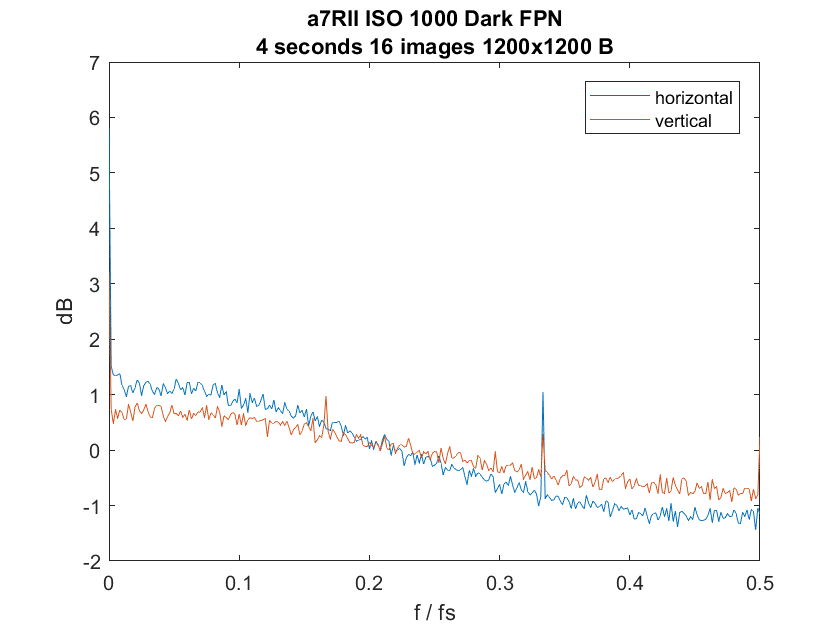
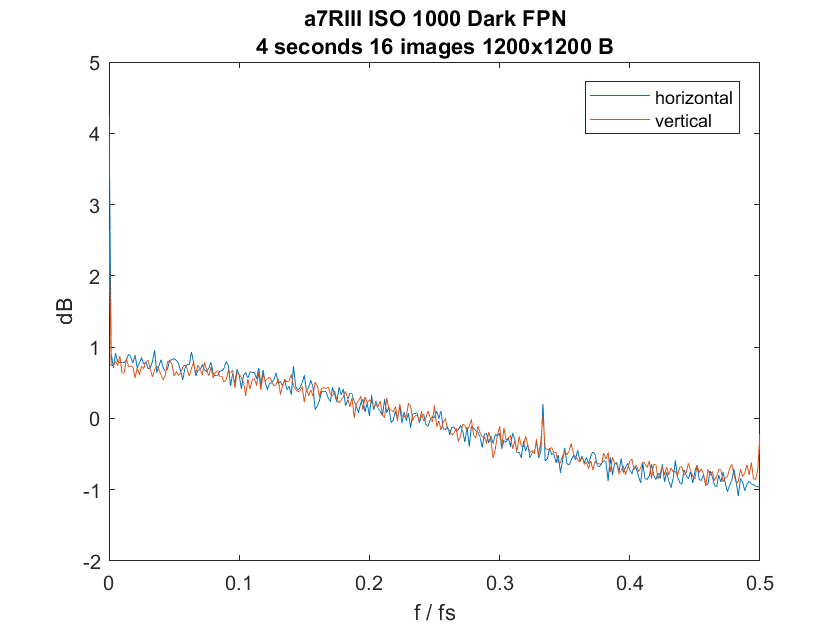
The blue channel:
The a7RIII is missing the spike in the horizontal direction at 1/3 the sampling frequency that I think is caused by smoothing over the PDAF pixels. It is also missing the slightly different slope in the two directions that you see in the a7RII images.
Now we see the spike at 1/3 the sampling frequency in both cameras, but it’s more pronounced in the a7RII. The slope anisotropy continues.
What does this all mean for star-eating? Not much, I’m afraid; I don’t think this is a good test to sort out the subtle differences that may exist between the two cameras.

FWIW the zero spatial frequency (DC) resulting from a Fast Fourier Transform is simply the average of all the values in the spatial image.
Yes. And that number is actually excluded from all the graphs. We are looking at just the ac components.