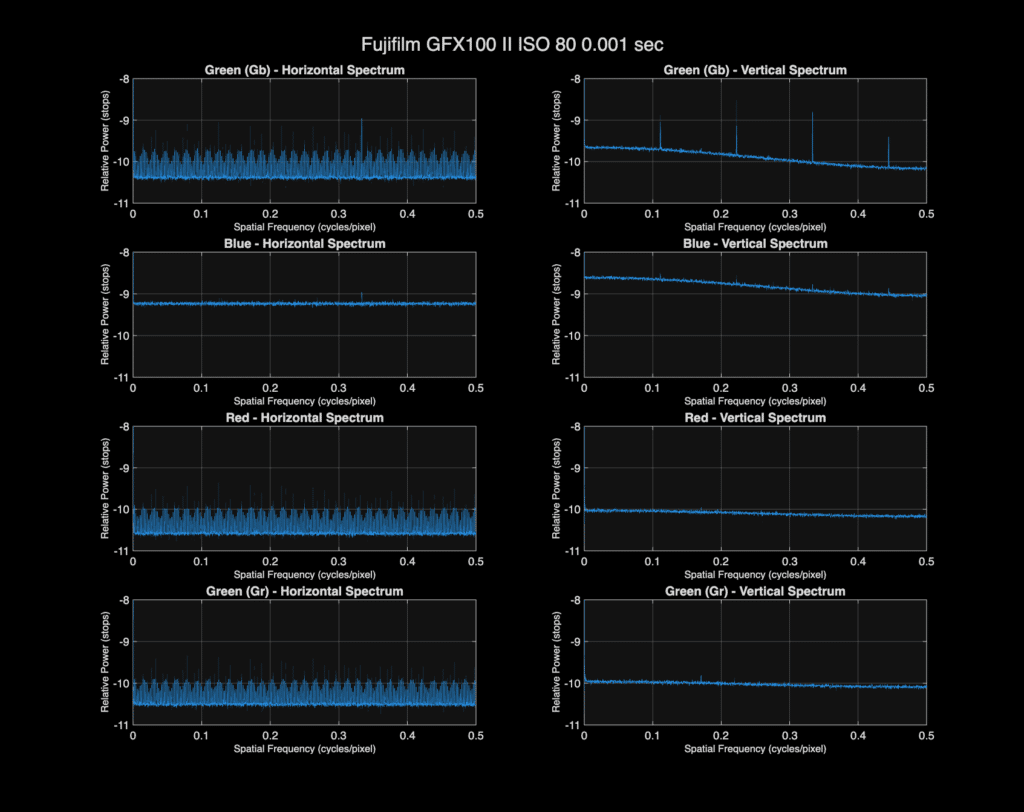
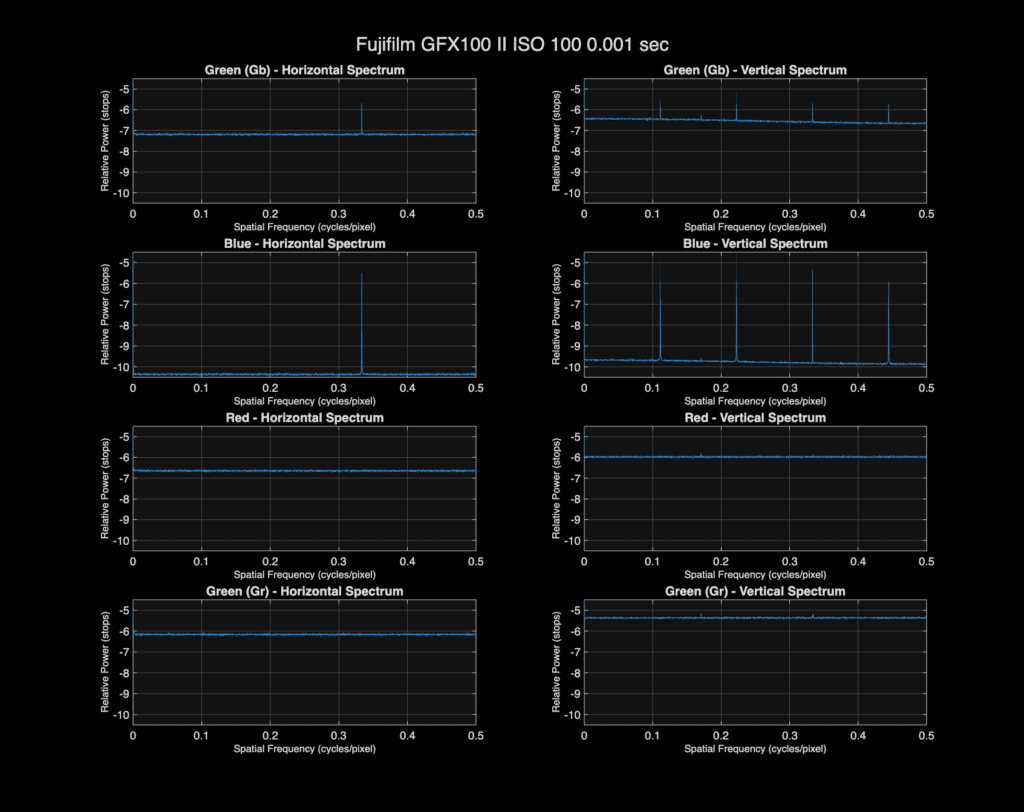
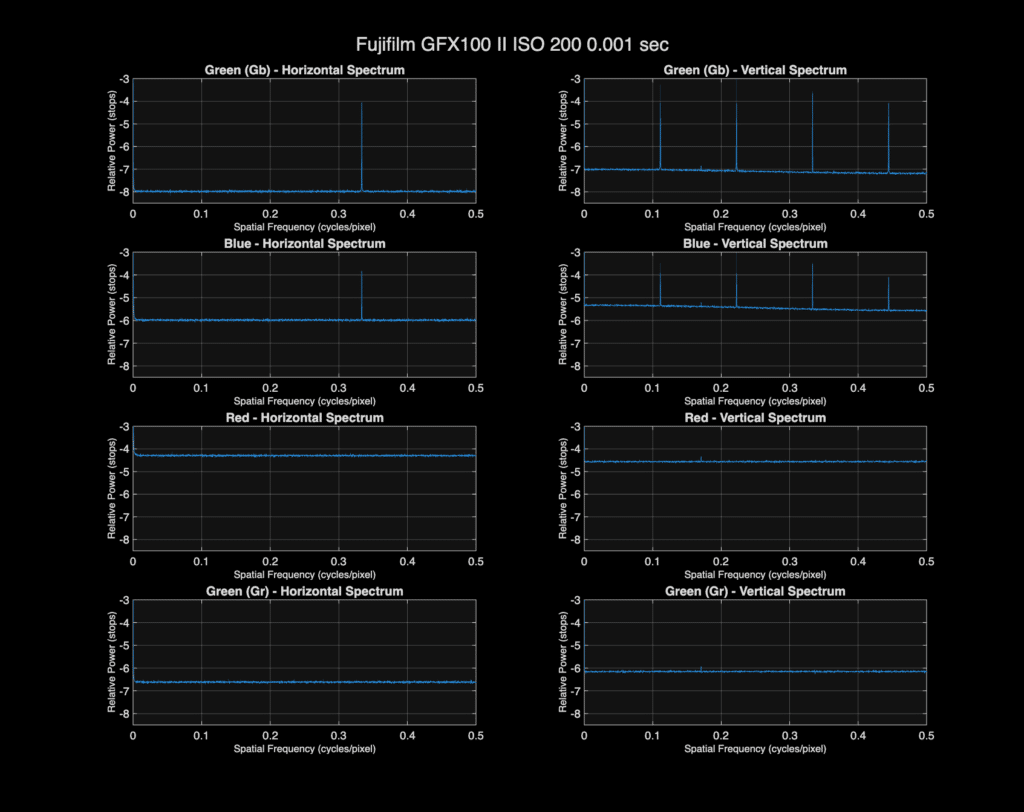
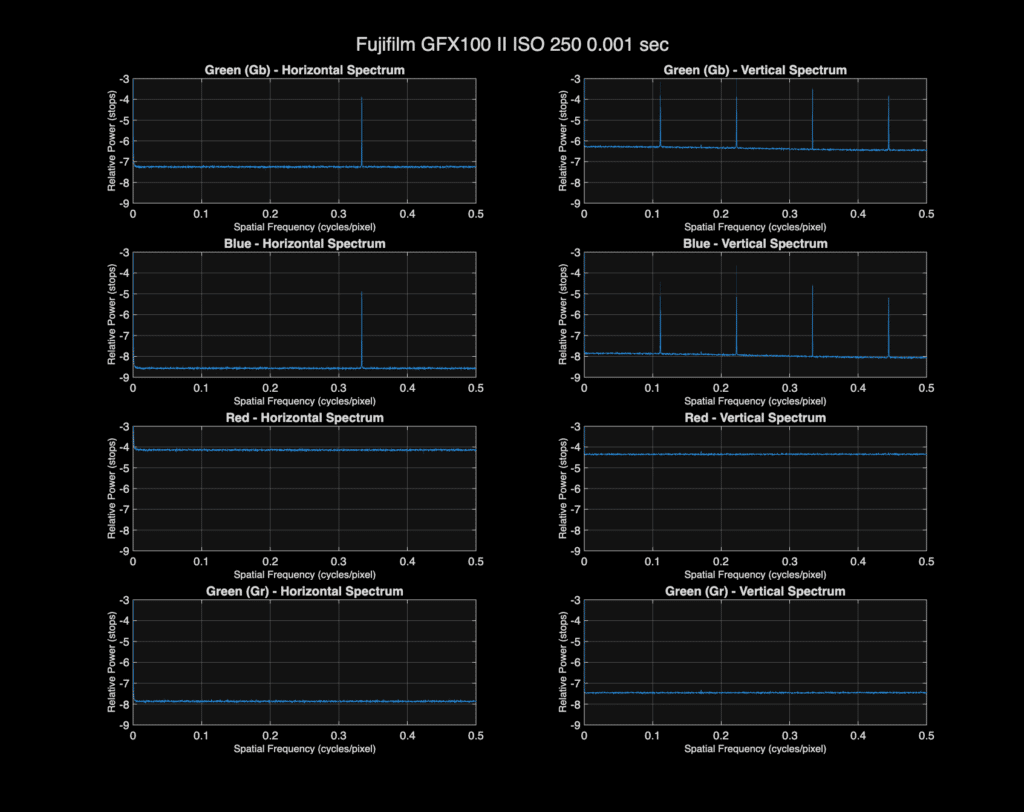
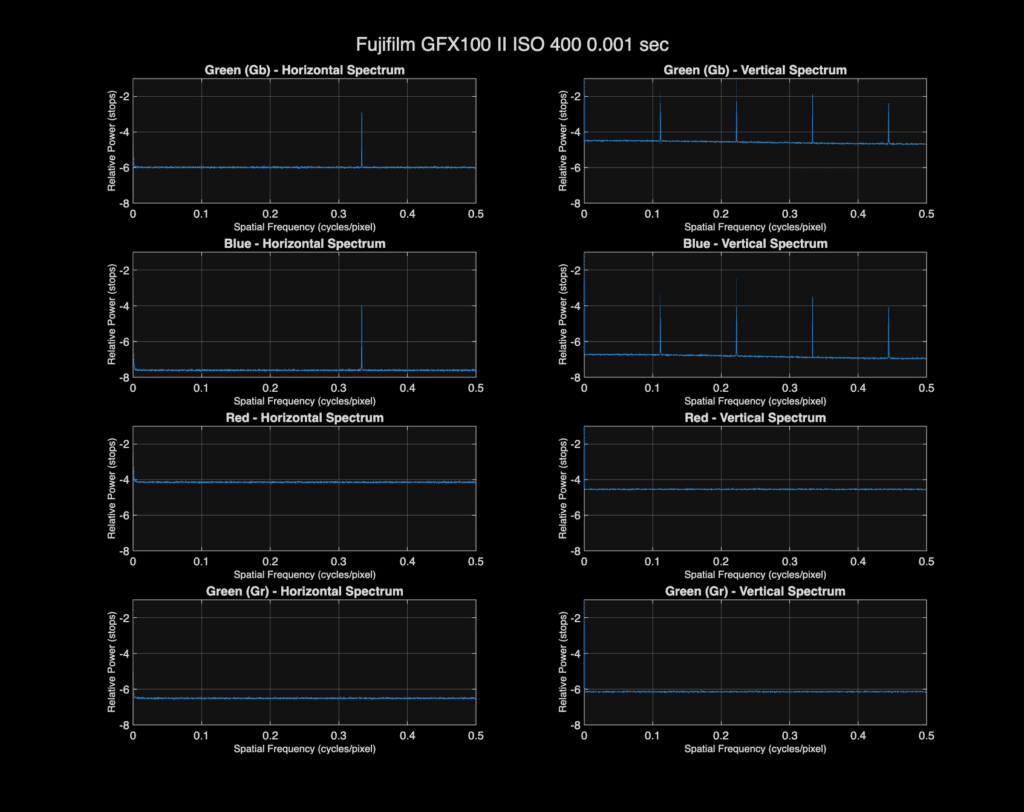
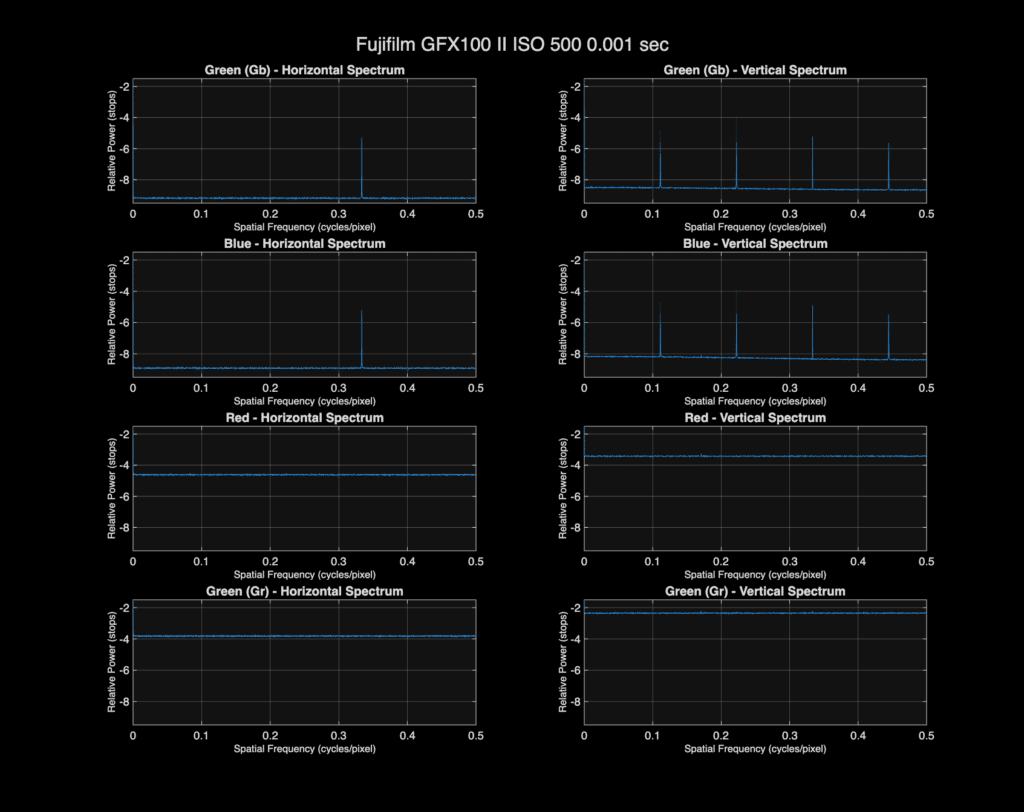
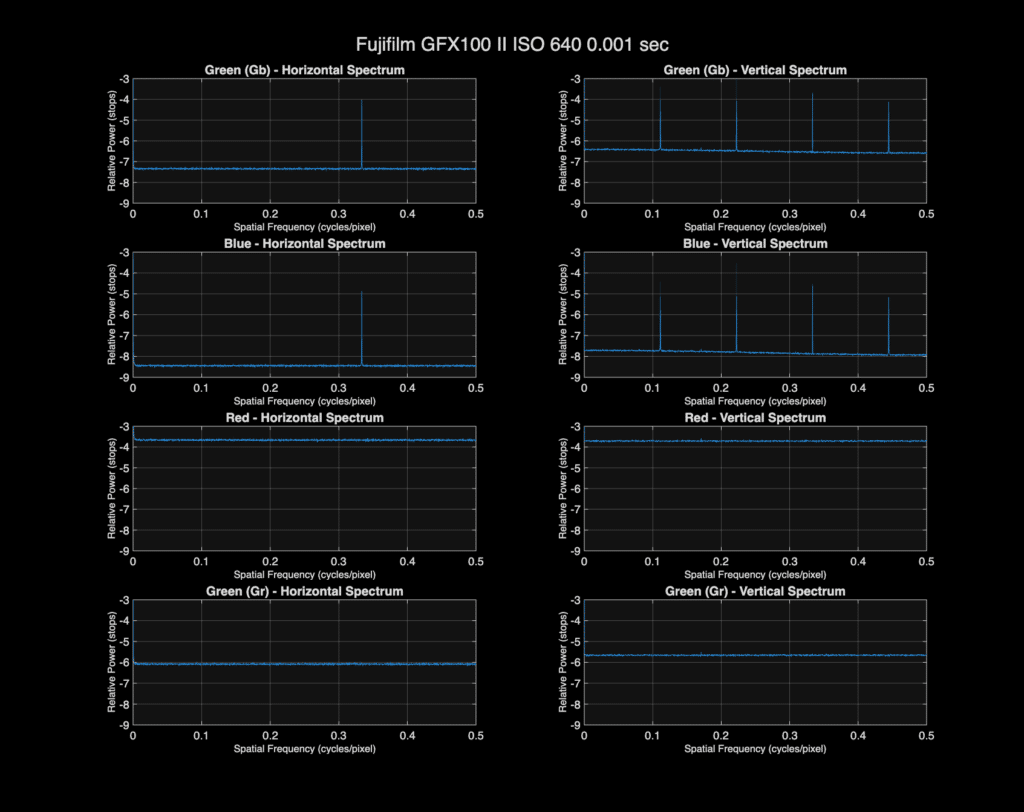
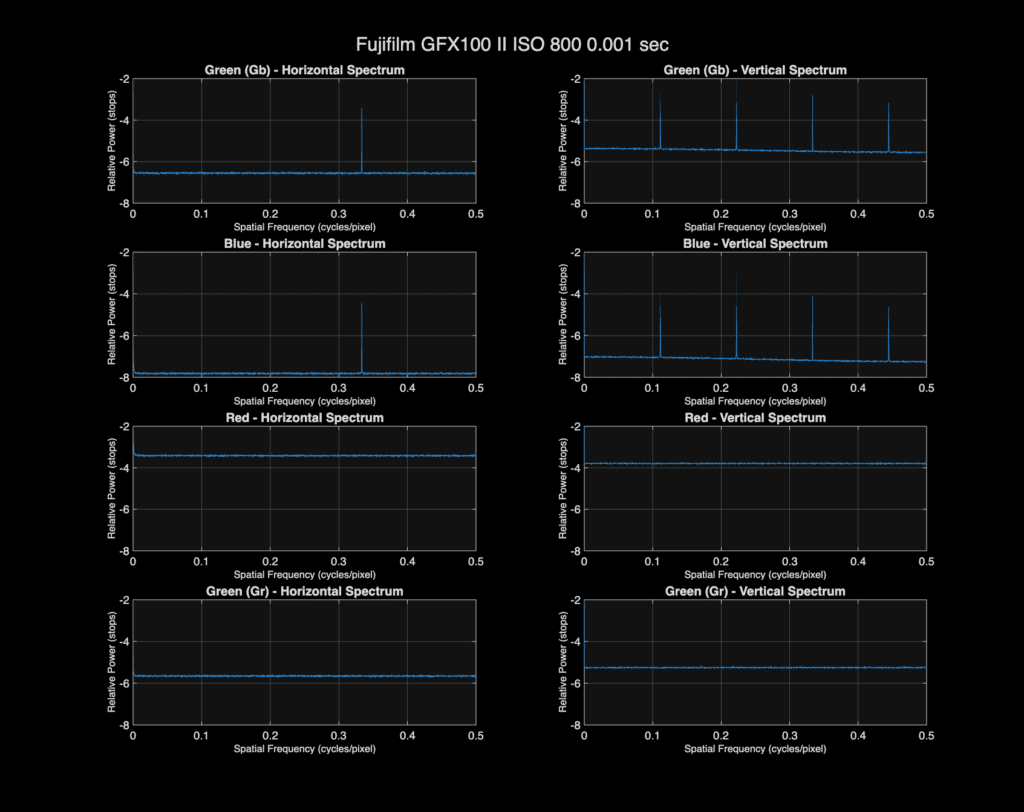
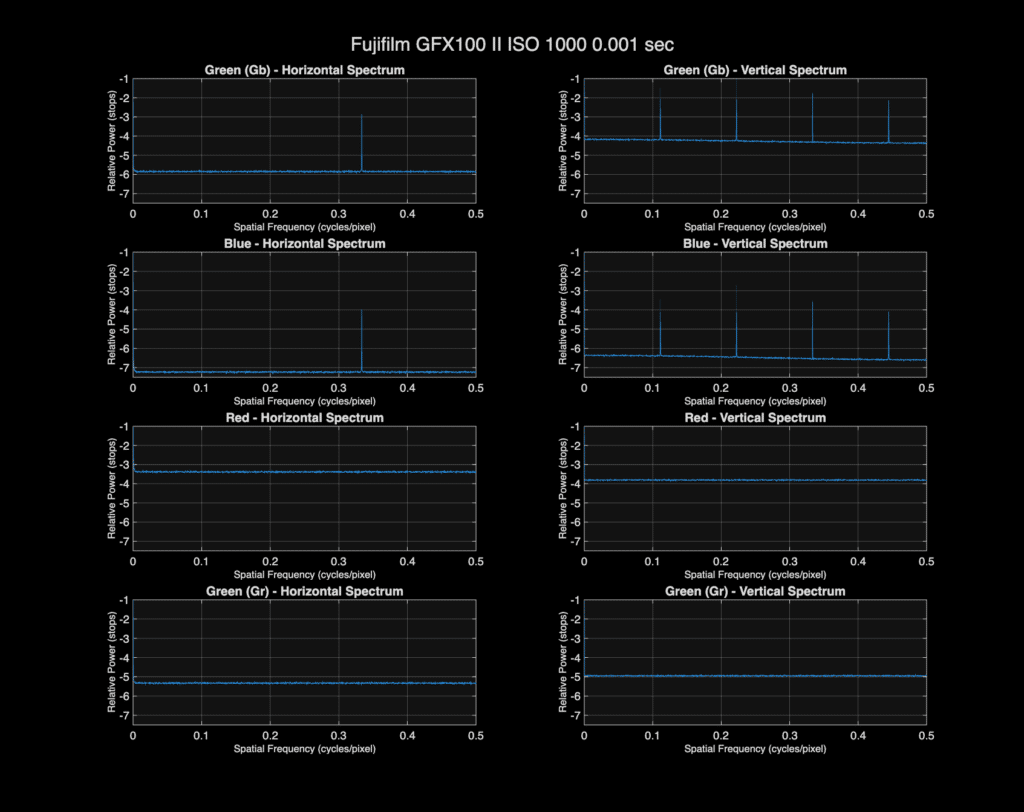
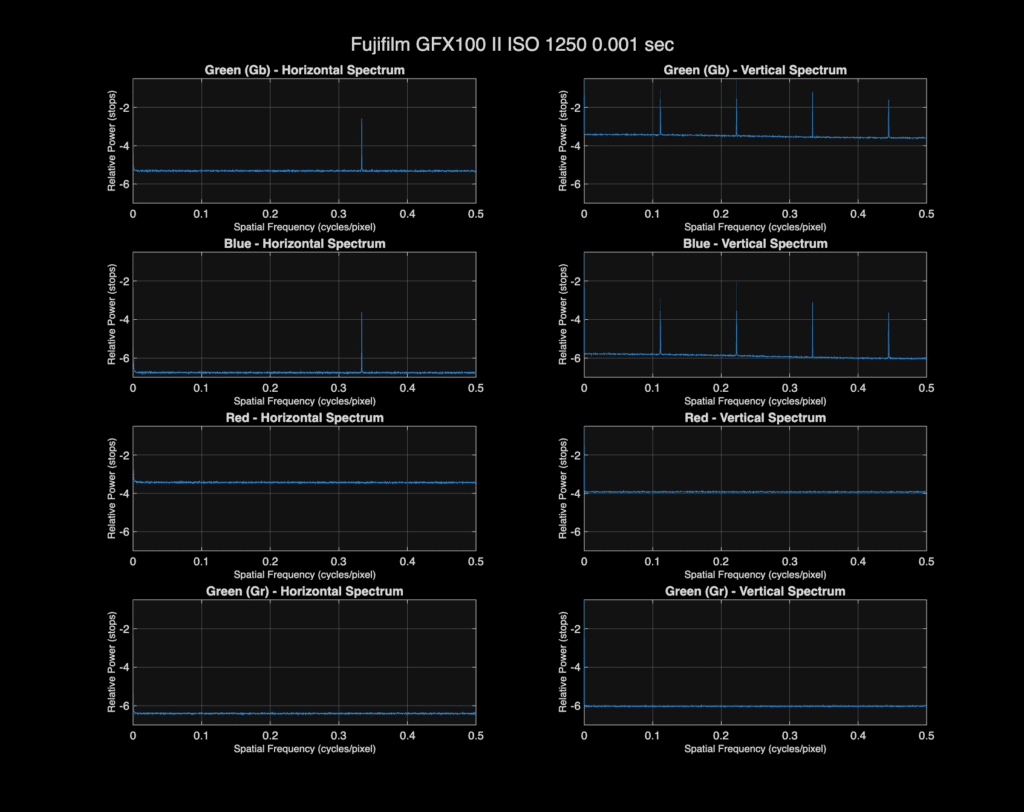
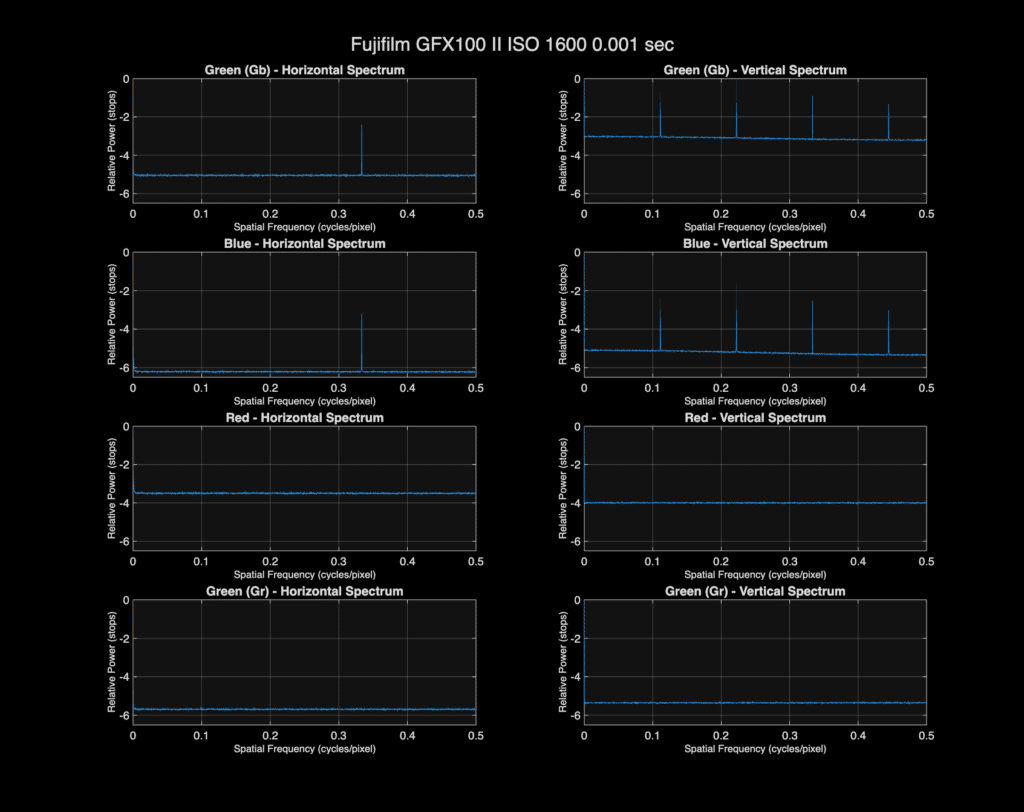
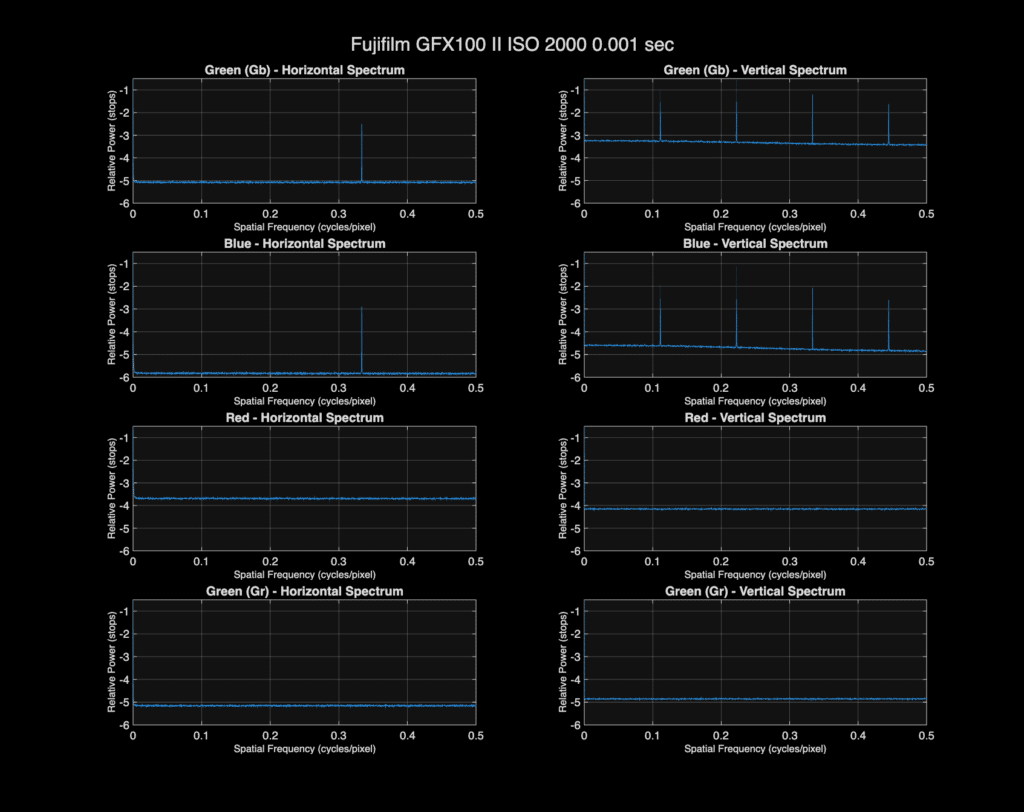
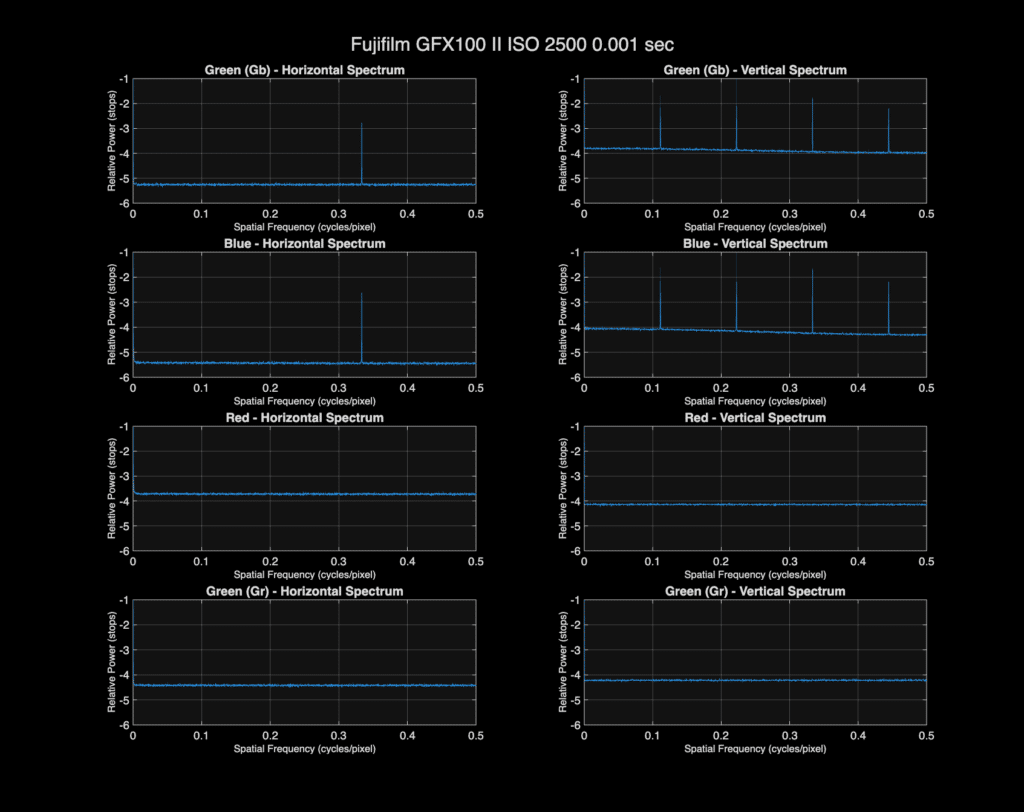
I’ve been looking for a better way to present read noise spectra, and I think I’ve found one. These graphs present the average horizontal spectra of each of the four raw channels, one ISO setting per eight-panel plot set. The reference level is preserved across the graphs, so that you can see the ensemble increase in read noise as the ISO is turned up.
You can see the noise levels drop on the ISO 500 test because of the switch to high conversion gain that occurs at that ISO. But the general nature of the spectra doesn’t change.
I’ll stop there. There aren’t any surprises that I’ve noticed as the ISO goes higher.



Leave a Reply