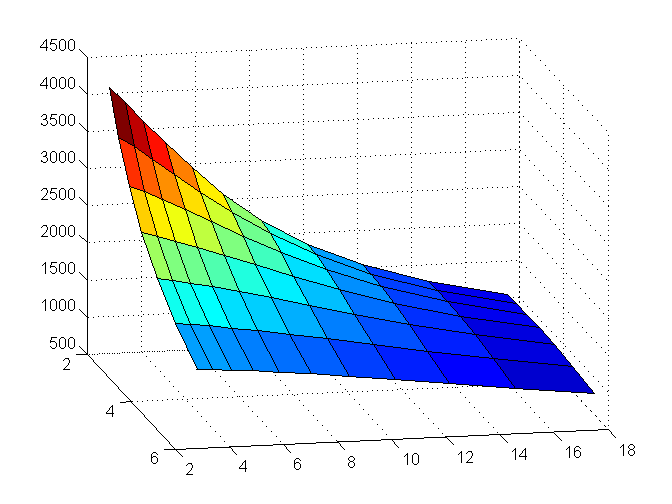
Now that I’ve got a fair amount of confidence in the MTF analysis, I went back to the model of the diffraction-limited lens, and ran a set of simulations at various f-stops and sensel pitches. Here’s a 3D look at the results, with MTF50 cycles/picture height the vertical axis, sensel pitch in um coming towards you, and f-stop running from left to right:
It looks like more lens resolution (wider f-stop, in this case) is better for all sensor resolutions, and more sensor resolution is better for all f-stops. Not a surprise, really.
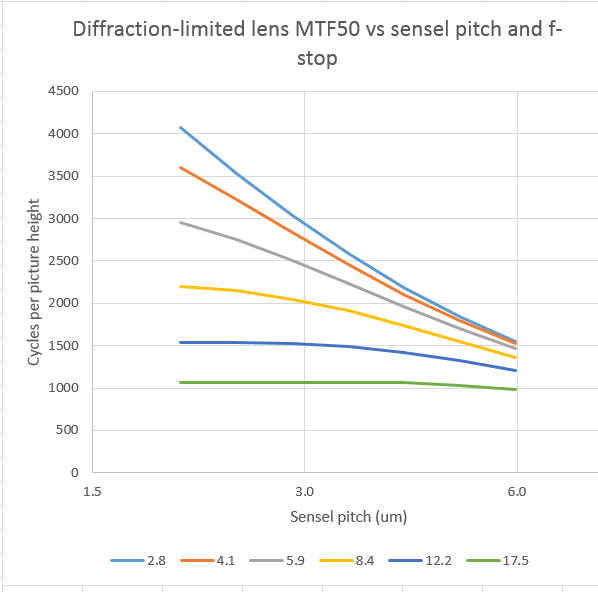
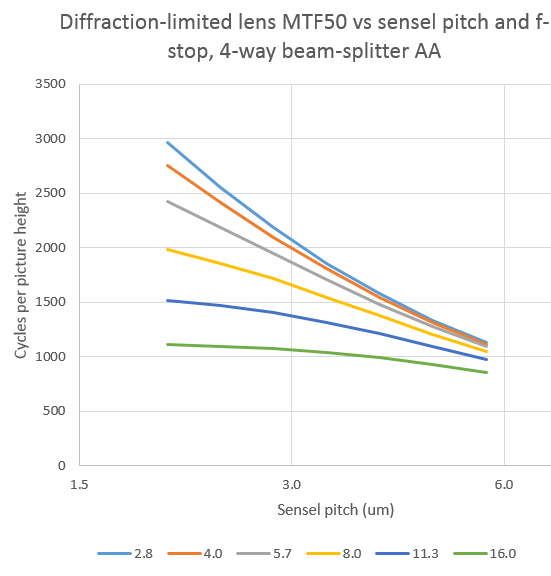
Let’s take a closer look. Here’s a family of curves at different f-stops plotted against sensel pitch:
Tightening up the sensel pitch doesn’t help the f/17.5 curve over the range in the plot, and only helps the f/12 curve in the range from 6 to 3 um. However, there are significant improvements in sharpness to be had across the entire range of sensel pitches for the other f-stops.
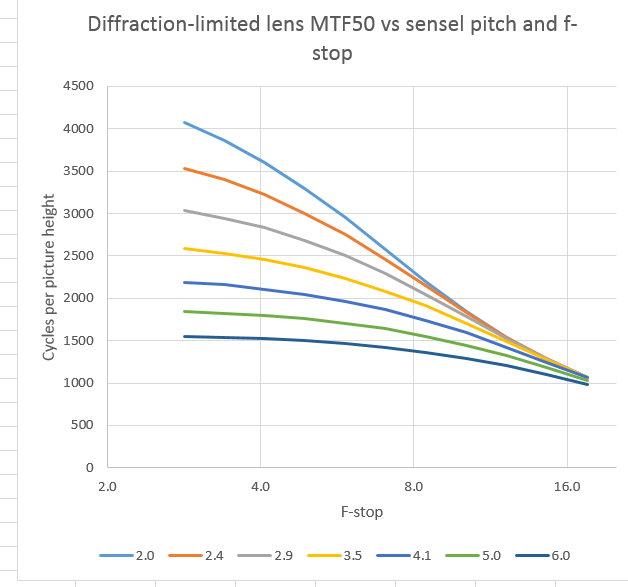
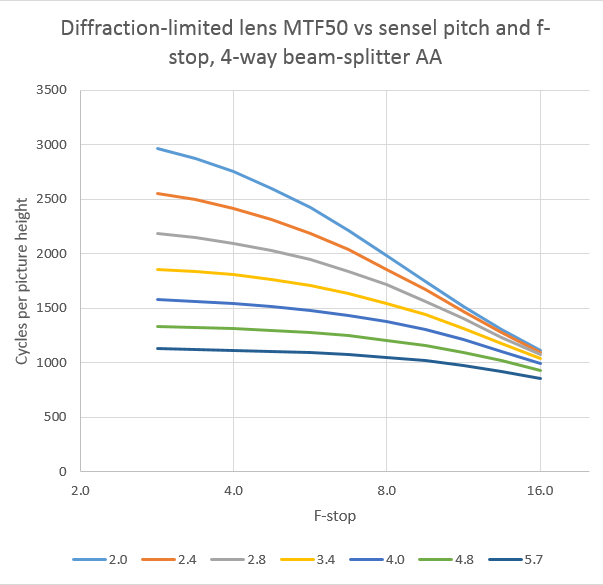
Now let’s look at the data the other way, with a family of curves at different sensel pitches plotted against f-stop:
Getting more resolution out of the lens by opening it up helps at all sensor resolutions, but it helps the most at the highest sensor resolutions.
So, in general, the answer to the question, “Would you like more lens resolution or more sensor resolution” is: “Yes.” Which would do you the most good depends on where you are on the 3D surface in the first graph.
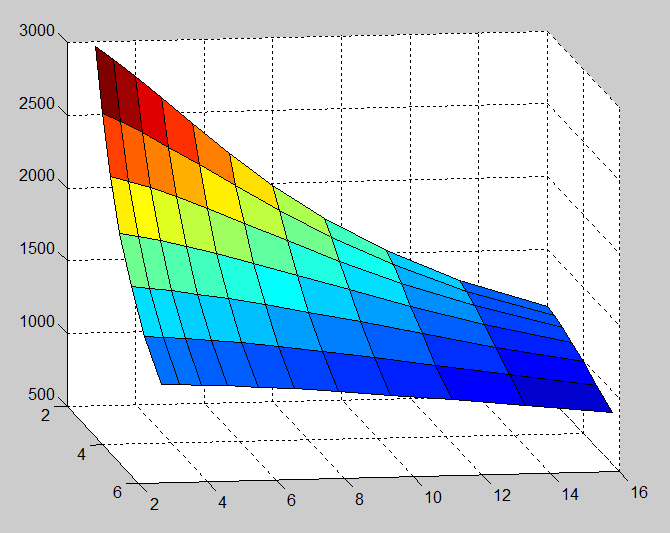
Adding a 4-way beam-splitting AA filter lowers the resolution somewhat, but doesn’t change the nature of the surface.
In three dimensions:
In two dimensions, with f-stop as the horizontal axis:
In two dimensions, with pitch as the horizontal axis:
Nice top graph! Next step in making it relevant to real life is extending it to 1um pitch, f/1 and adding primary lens aberrations.
I think it would then gradually plateau on the pitch axis (I am surprised we are not seeing some more evidence of that even at 2um above) and show a lens-dependent rounded peak from about f/3 to f/8 on the aperture axis.
The answer to The Question could then be a bit more quantitative than *Yes.* 🙂
How’s this for a more quantitative way to deal with The Question? For every point on the pitch-fstop grid, computed the direction that gives the steepest ascent in resolution, and vary the length by the slope in that direction. In continuous space, that’s just the first derivative of resolution with respect to the other two variables. Now plot that as a vector field on the pitch-fstop grid, like you see sometimes for wind maps.
Jim