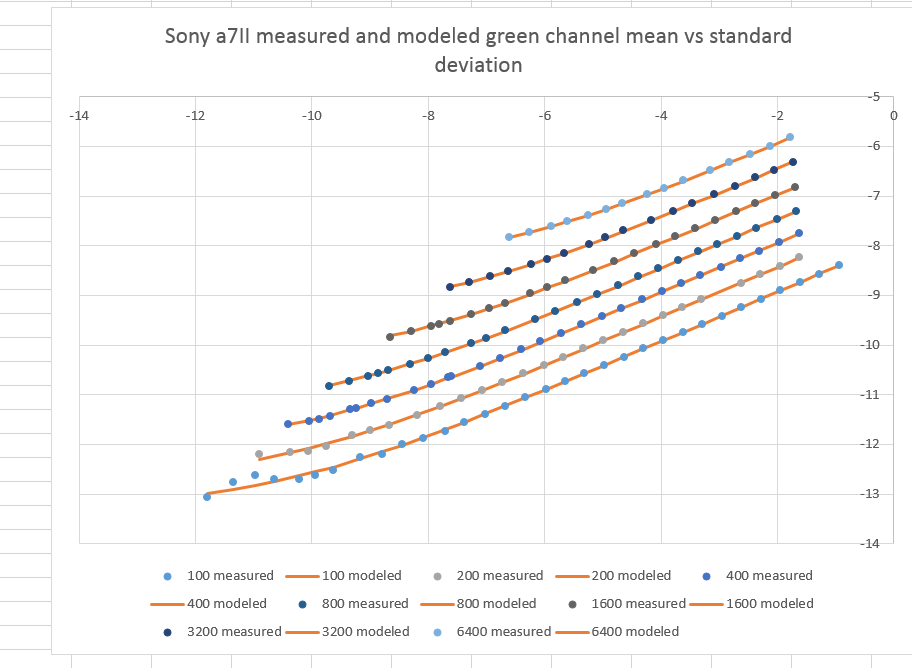
In the post before last, I modeled the Sony a7II over a range of in-camera ISO settings, and reported on the results. Today, I’ll show you what happens when you model the camera one ISO at a time. This is a much simpler task, aside from the fact that you have to do it over and over. It also tends to produce closer matches between the modeled and measured values.
But what it’s really good at is finding places where the camera does something not predicted in the standard model when you twist that ISO knob.
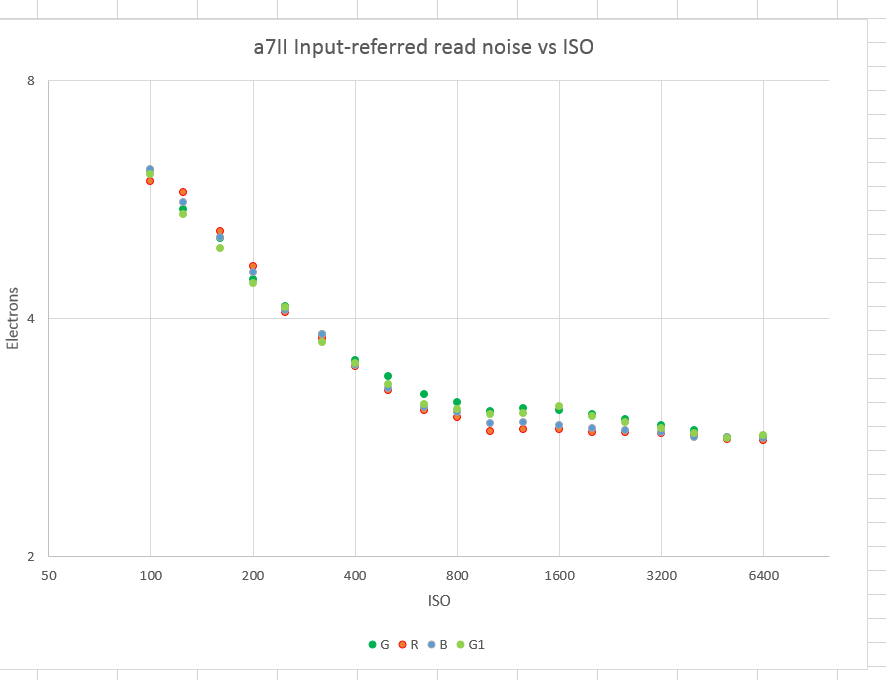
Let’s take a look at some results, first for read noise:
The read noise is reported in electrons before the amplifier, assuming that all the read noise is there (the post-amp read noise is zero).
One of the things this curve tells us is that there is really very little reason to turn the ISO knob on the a7II much past 1000. The read noise doesn’t drop appreciably after that, so you’re better off pushing in post. I’ll be posting the results of another test that deals with this subject later.
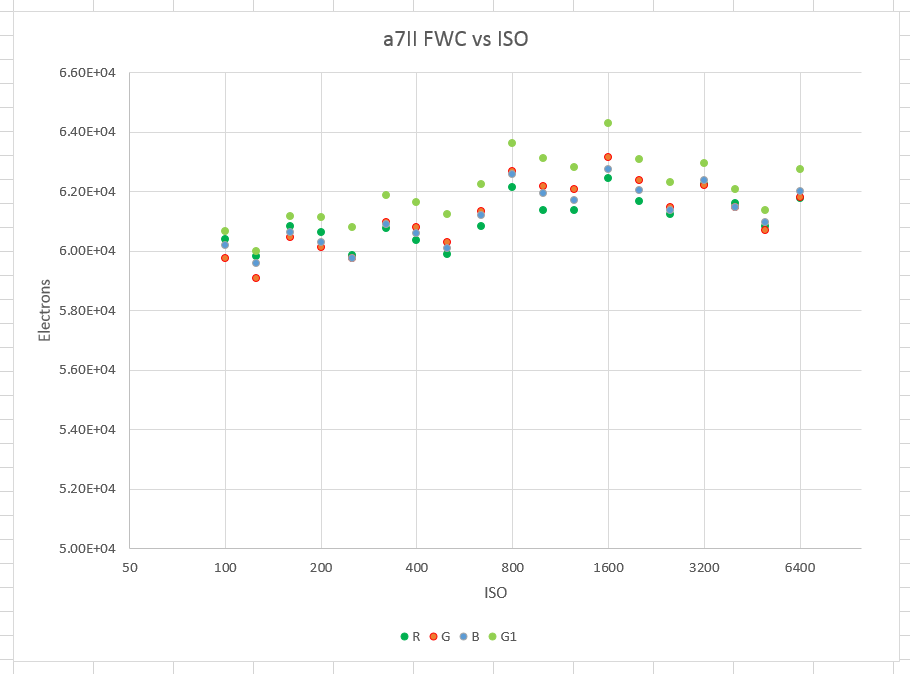
Now let’s see how the modeled full-well capacity (FWC) changes with ISO setting:
The short answer is that it doesn’t. However, there seems to be a very slight systematic upward slope until about ISO 1600. I don’t know what that’s about, and the effect is too small for me to care.
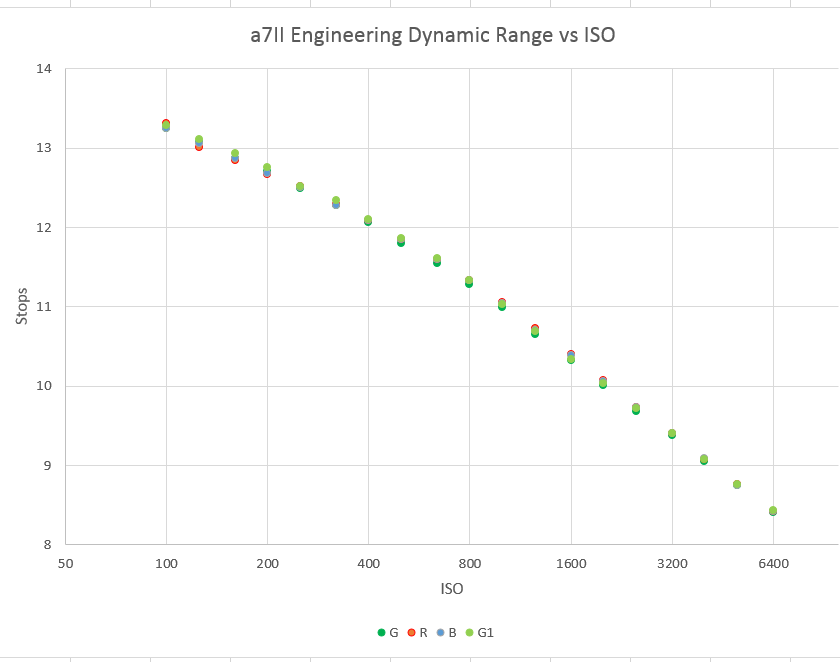
There’s another way to look at read noise, and that’s as the noise floor that limits dynamic range. This is called “Engineering Dynamic Range.” I happen to look at that name as a mild insult to engineers, but the term is ubiquitous, so I’ll use it. I prefer something I call “Photographic Dynamic Range”, which puts the bottom usable signal at about a SNR of 10.
But enough of that. Here’s the engineering dynamic range of the a7II as a function of ISO setting:
There are no jumps or lumps in the curve that would indicate some unusual chip design or raw processing wizardry. There is a slight rounding of the curve at low ISOs. This is not unusual.
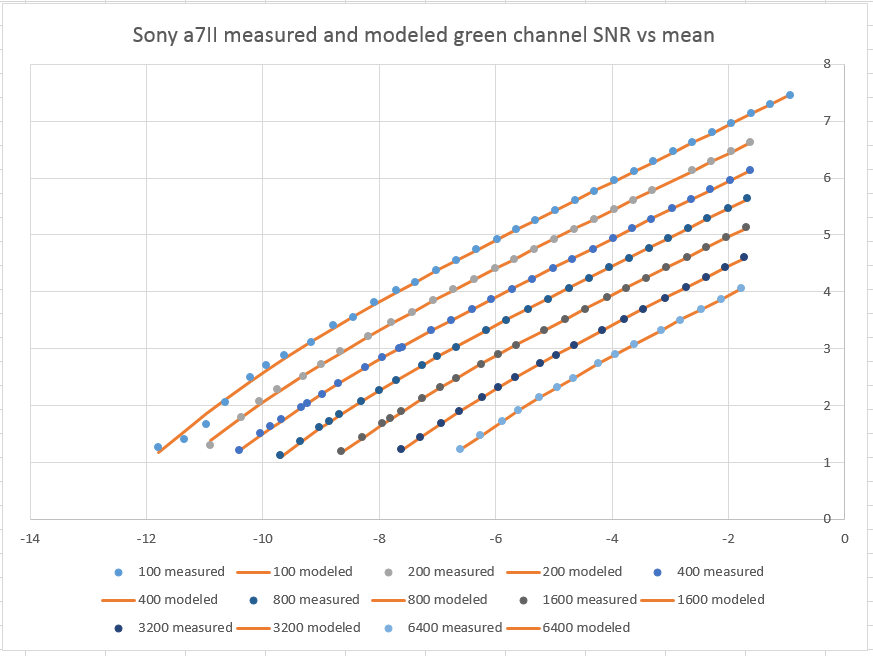
How well does the modeled data fit the measured data? Pretty darned well:
Leave a Reply