This is the fourteenth post in a series of tests of the Fujifilm GFX 100, Mark II. You can find all the posts in this series by going to the Categories pane in the right hand panel and clicking on “GFX 100 II”.
Using the target I wrote about a couple of posts ago, I made the exposures necessary to produce a set of photon transfer curves (PTCs) for the GFX 100 II. I used the 110 mm f/2 lens, EFCS, single shot, and 14-bit precision. There were a couple of false starts because the camera changes it raw black point with ISO, and seemingly something else. In an earlier series with similar settings, ISO 80 caused the camera to set the black point to 64, and at ISO 100 and above, the black point was 1024. In the captures for this series, the black point was 64 for both ISO 100 and ISO 80, with all the ISOs above 100 getting 1024. I tested all the settable ISOs from 80 through 500. That’s enough to get a look at what happens when the camera changes to high conversion gain, and it looks from my previous testing that the camera is about the same as the GFX 100 and GFX 100S above ISO 500.
The PTCs for ISOs 80 and 100:
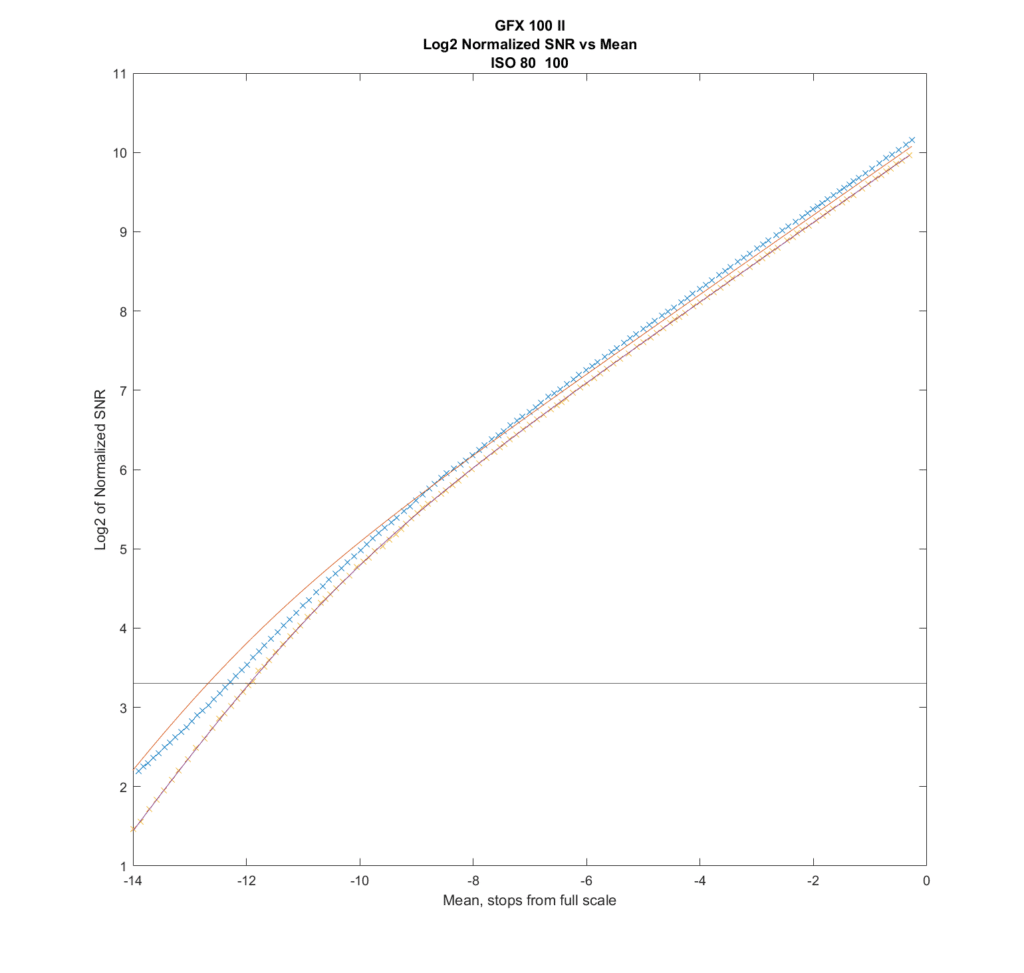
The horizontal axis is the mean signal level, in stops from full scale. The vertical axis is the log base 2 of the signal to noise ratio (SNR), normalized the same way that BIll Claff normalizes his photographic dynamic range curves. The black horizontal line marks the threshold that Bill uses for his PDR measurements. You can thus read PDR right off the graph by noting where the curves cross the horizontal black line and mentaly dropping the minus signs on the horizontal axis.
The crosses are the measured points, and the lines are the modeled ones. The blue crosses and the orange line are for ISO 80. The modeled results don’t track the measured ones very well. The yellow crosses and the dark red line are for ISO 100. The modeled and measured curves are right on top of each other.
Here are the PTCs for ISOs 125 through 500:
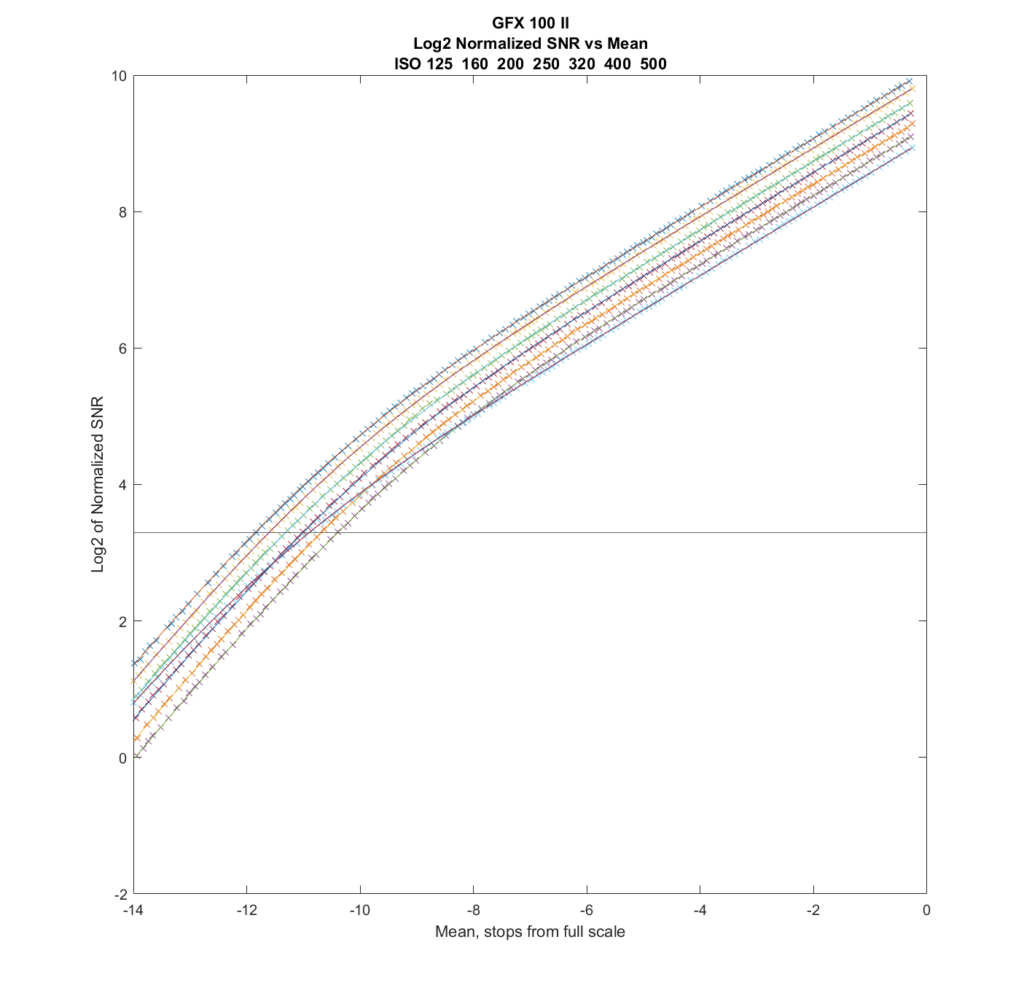
The only curves that merit special attention are the crosses and line that are the lowest on the right side of the graph. They are for ISO 500, the first ISO that uses the high conversion gain setting. You can see as the signal level goes down (moving to the left on the graph), the ISO 500 curves start to look better (a higher SNR). At 14 stops down from full scale, the ISO 500 SNR is about the same as the ISO 200 SNR. The modeled data fits the measured data very well.
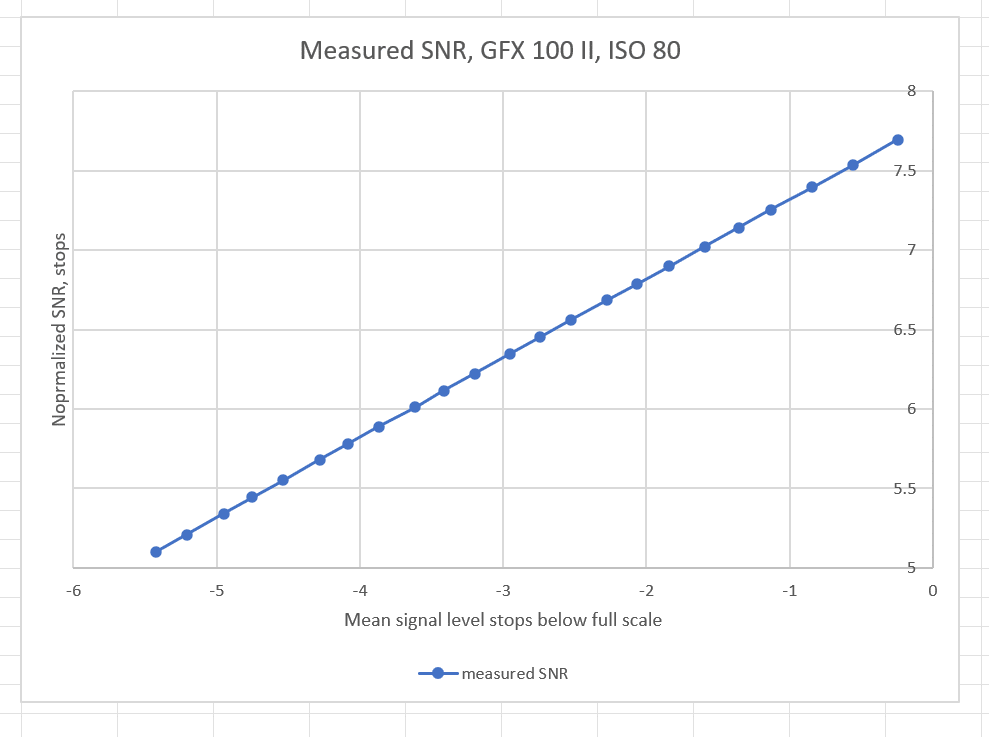
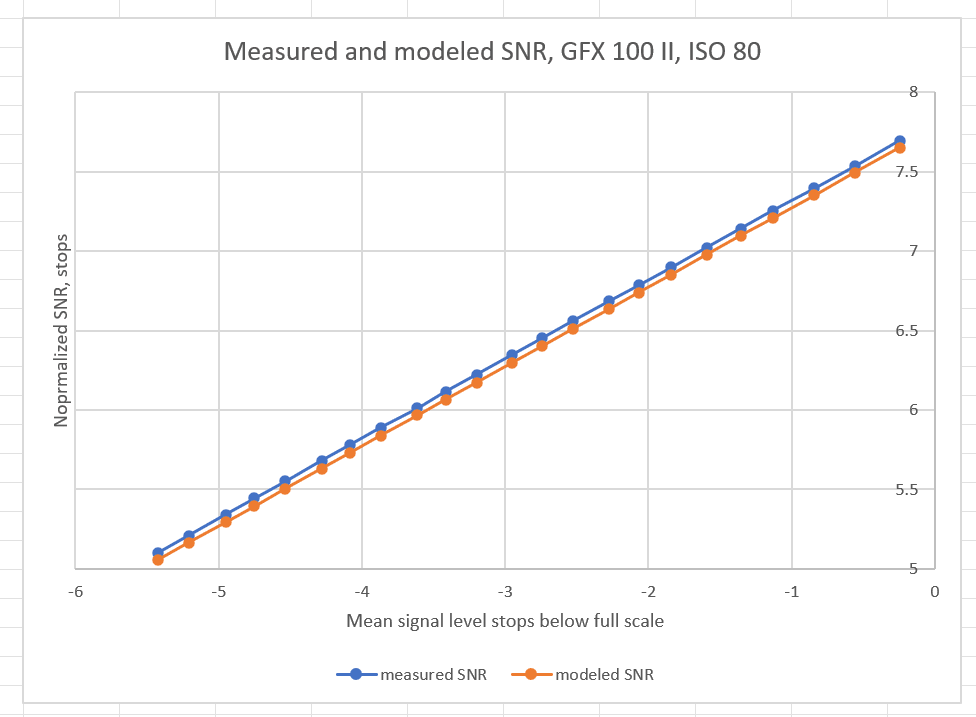
I was suspicious that Fuji had increased the full well capacity at ISO 80 by letting the voltage vs charge curve go more nonlinear near saturation. Taking a closer look at the upper end of the ISO 80 curves, that doesn’t appear to be the case.
Looking at the full well capacities the modeler calculated, we see this:
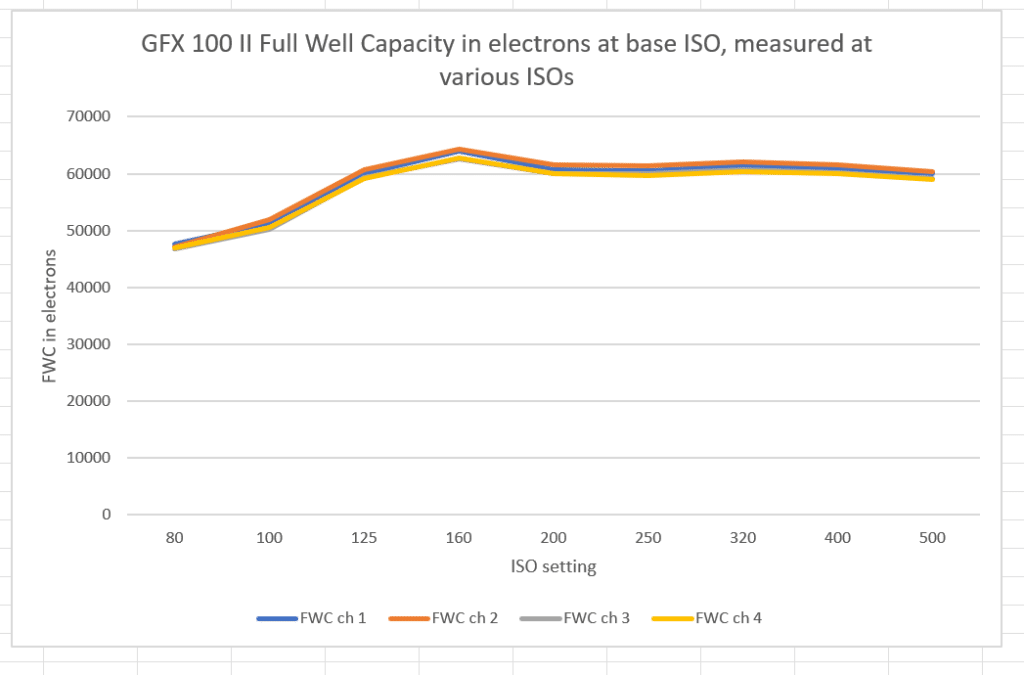
You’re looking at the full well capacities at base ISO calculated by the modeler at each of the ISOs from 80 through 500. The four channels are the four raw channels. As expected, they are all about the same. In a perfect world, the FWCs at each ISO setting would all be the same. At ISO 100 and 200, the GFX 100 modeled base ISO FWCs were about 44,000 electrons. Above that, they were about 54,000 electrons. So we’re seeing an increase over the earlier camera, but it’s not the 30% that Fuji claimed (about 14% at low ISOs and 7% at high ISOs). Part of this may be the modeling of the ISO 80 setting. Near full scale, the model is predicting lower SNRs than we’re actually seeing.
Now let’s look at the read noise referred to the photodiodes, measured in electrons.
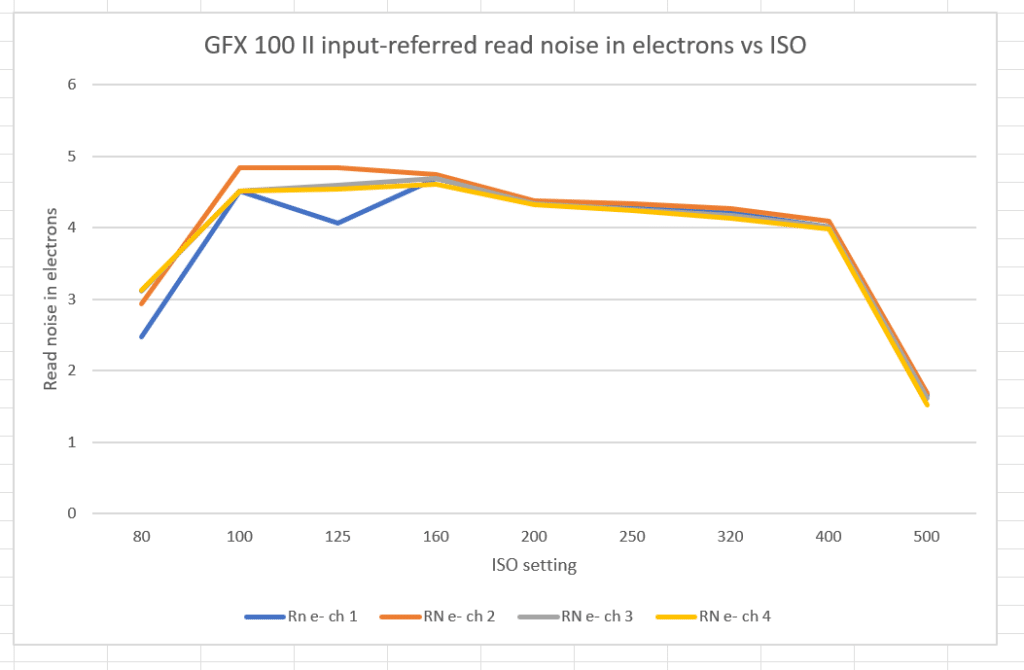
The camera is fairly ISOless from ISO 100 through ISO 400. There’s a big improvement in read noise at ISO 500 where the higher conversion gain kicks in. But there’s an anomaly similar to what we saw in the EDR curves. The read noise at ISO 80 iw way lower than I would think it should be. I still don’t have an explanation for that.
Read noise for the GFX 100 was a bit less than 4 electrons at the ISOs below where the camera changed to high conversion gain. That’s a bit better than we’re seeing with the new camera. That’s what the EDR curves showed, too. The read noise above ISO 500 is about the same for the two cameras.
Eric says
2.5 electrons and 4.5 difference should be visible in deep shadows.