This is one in a series of posts on the Fujifilm GFX 100S. You should be able to find all the posts about that camera in the Category List on the right sidebar, below the Articles widget. There’s a drop-down menu there that you can use to get to all the posts in this series; just look for “GFX 100S”.
The day before yesterday, I reported on longitudinal chromatic aberration (LoCA), modulation transfer function at 50% contrast (MTF50), and focus shift with f-stop on the Fujifilm 110 mm f/2 GF lens. Now I’ll do the same with the 80 mm f/1.7 GF lens.
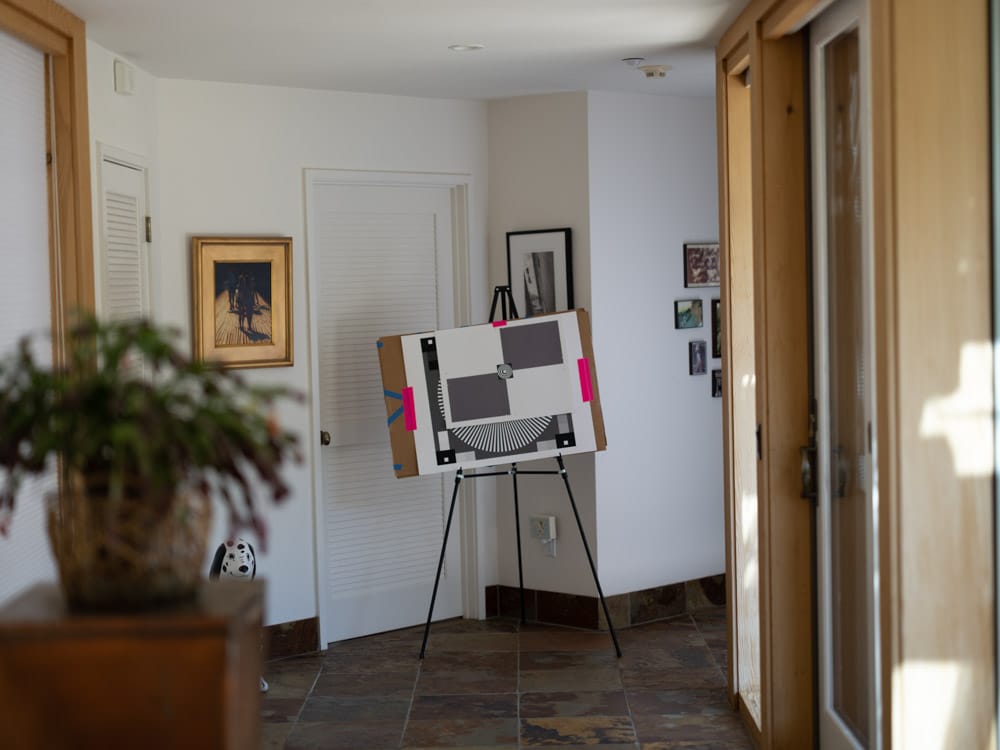
The scene:
The protocol:
- RRS carbon fiber legs
- C1 head
- Target distance 7 meters for a 80 mm lens
- ISO 100
- Electronic shutter
- 10-second self timer
- f/1.7 and f/2 through f/11 in whole-stop steps
- Exposure time set by camera in A mode
- Focus bracketing, step size 1, 80 exposures
- Initial focus well short of target
- Convert RAF to DNG using Adobe DNG Converter
- Extract raw mosaics with dcraw (I’ll change this to libraw and drop the DNG conversion when I get the chance, but the Matlab program that controls all this is written for dcraw)
- Extract slanted edge for each raw plane in a Matlab program the Jack Hogan originally wrote, and that I’ve been modifying for years.
- Analyze the slanted edges and produce MTF curves using MTF Mapper (great program; thanks, Frans)
- Fit curves to the MTF Mapper MTF50 values in Matlab
- Correct for systematic GFX focus bracketing inconsistencies
- Analyze and graph in Matlab
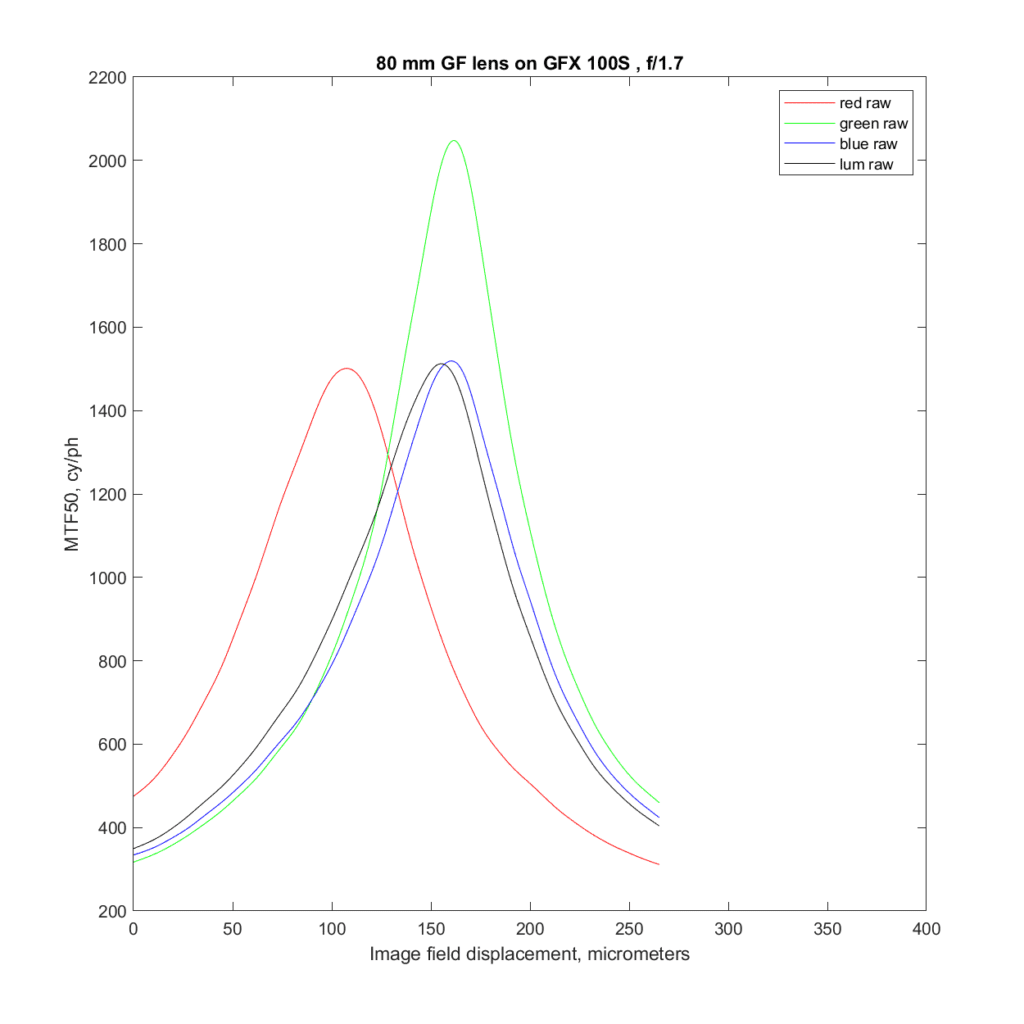
Here’s a graph of the MTF50 in cycles per picture height (cy/ph) wide open:
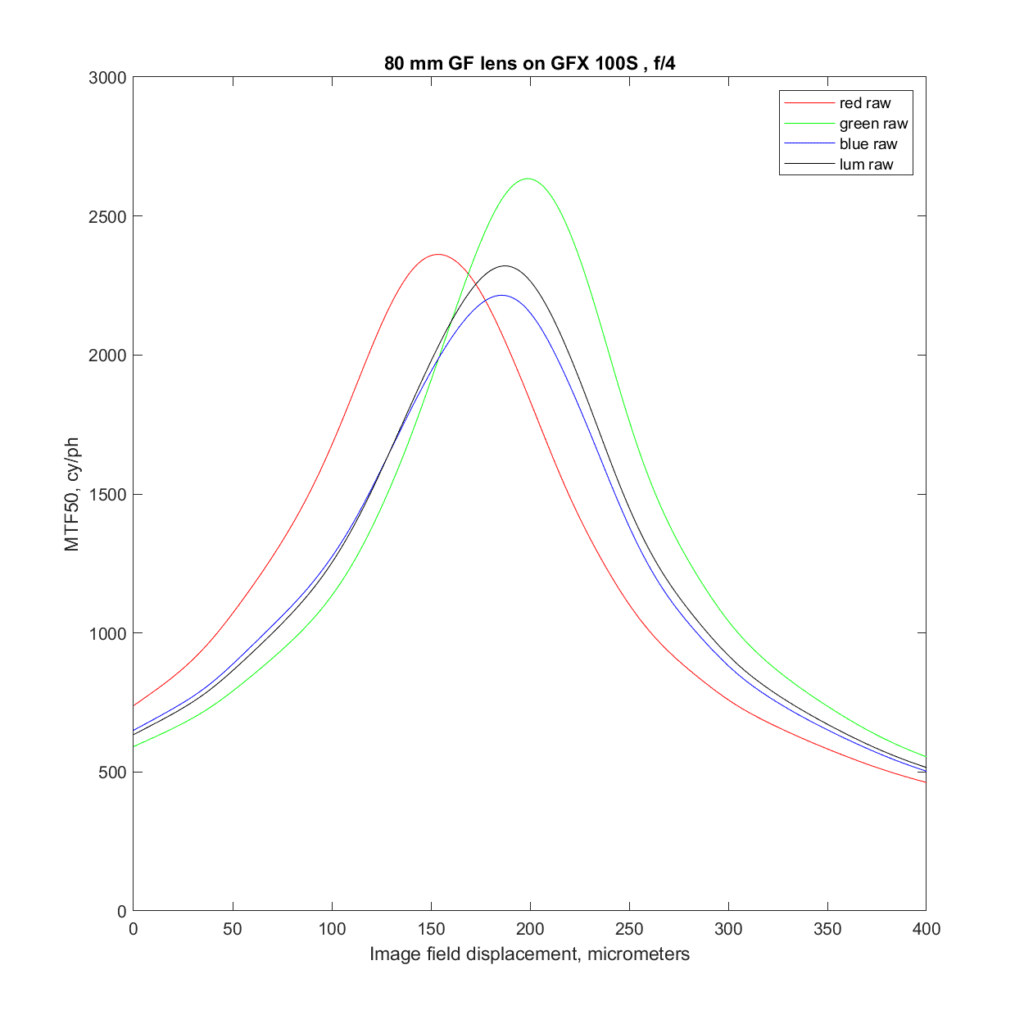
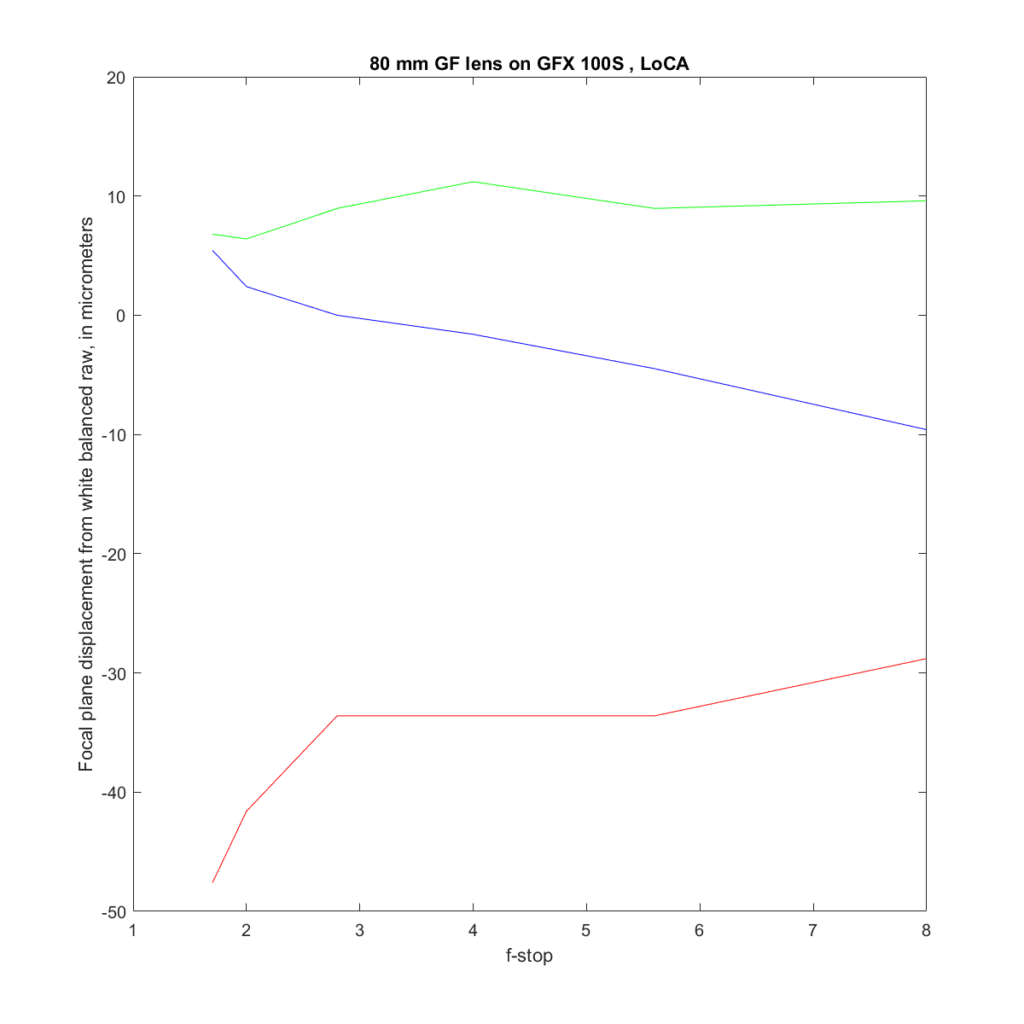
Let me decode the chart. The vertical axis is MTF50 in cycles/picture height. The horizontal axis is displacement of the sensor die (image field) focal plane in micrometers. In the object field (the subject side of the lens) the left side of the chart represents front-focusing, and the right side of the graph represents back focusing. There are four lines plotted. The red on is the red raw channel, the blue one is the blue raw channel, and the green one is the average of the two green raw channels. The black line is a combination of the other three lines after white balancing to the target. It can be considered a stand-in for a luminance MTF50 curve. The white-balanced (WB) raw curve peaks at about the same place as the green curve, since green is the main component of the WB raw curve. However, the peak of the WB raw curve is lower than the green curve, because the red and blue curves don’t peak in the same place as the green curve. That is the result of the lens’ longitudinal chromatic aberration (LoCA).
The height of the black curve at its peak is the best estimate of the sharpness of the lens that can be derived from this chart. In this case, it is a lot lower than the gree channel curve because the lens has considerable LoCA.
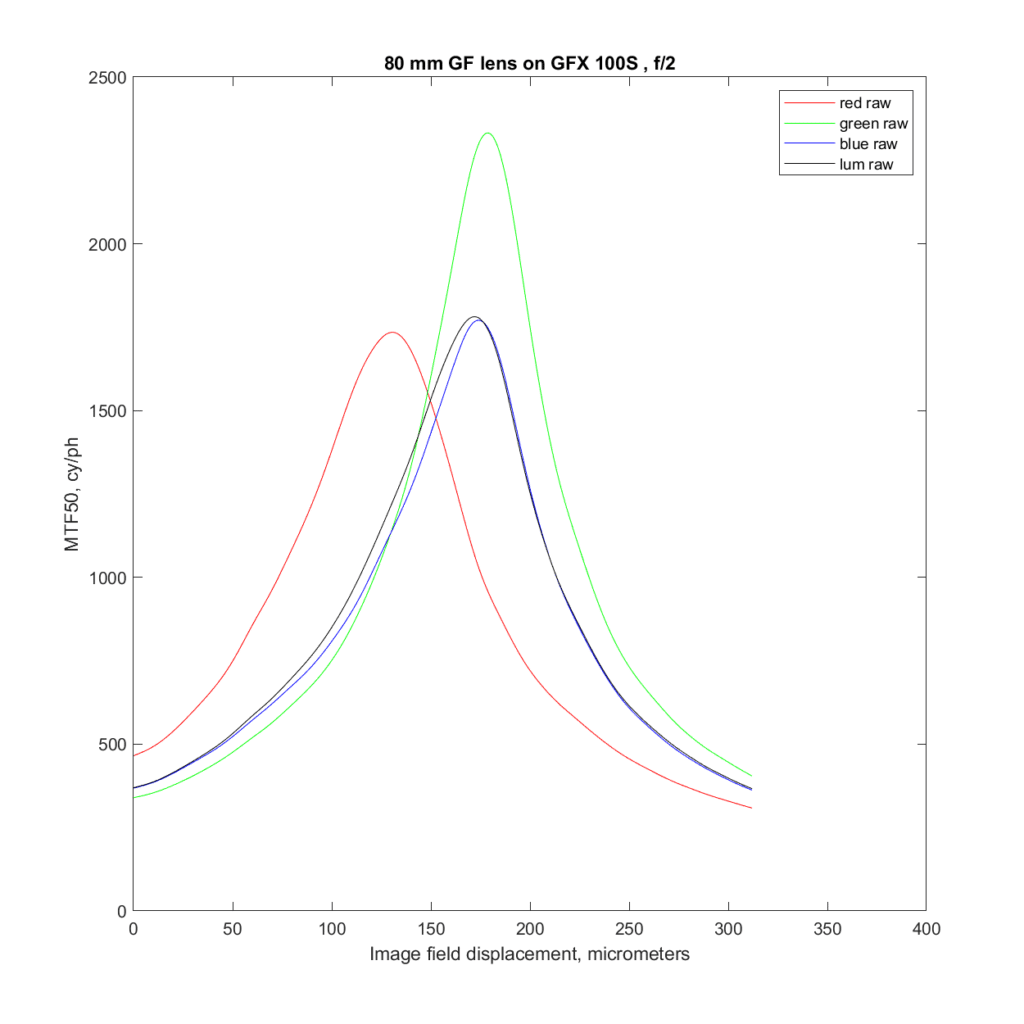
The lens is a bit sharper at f/2, but there is still a lot of LoCA.
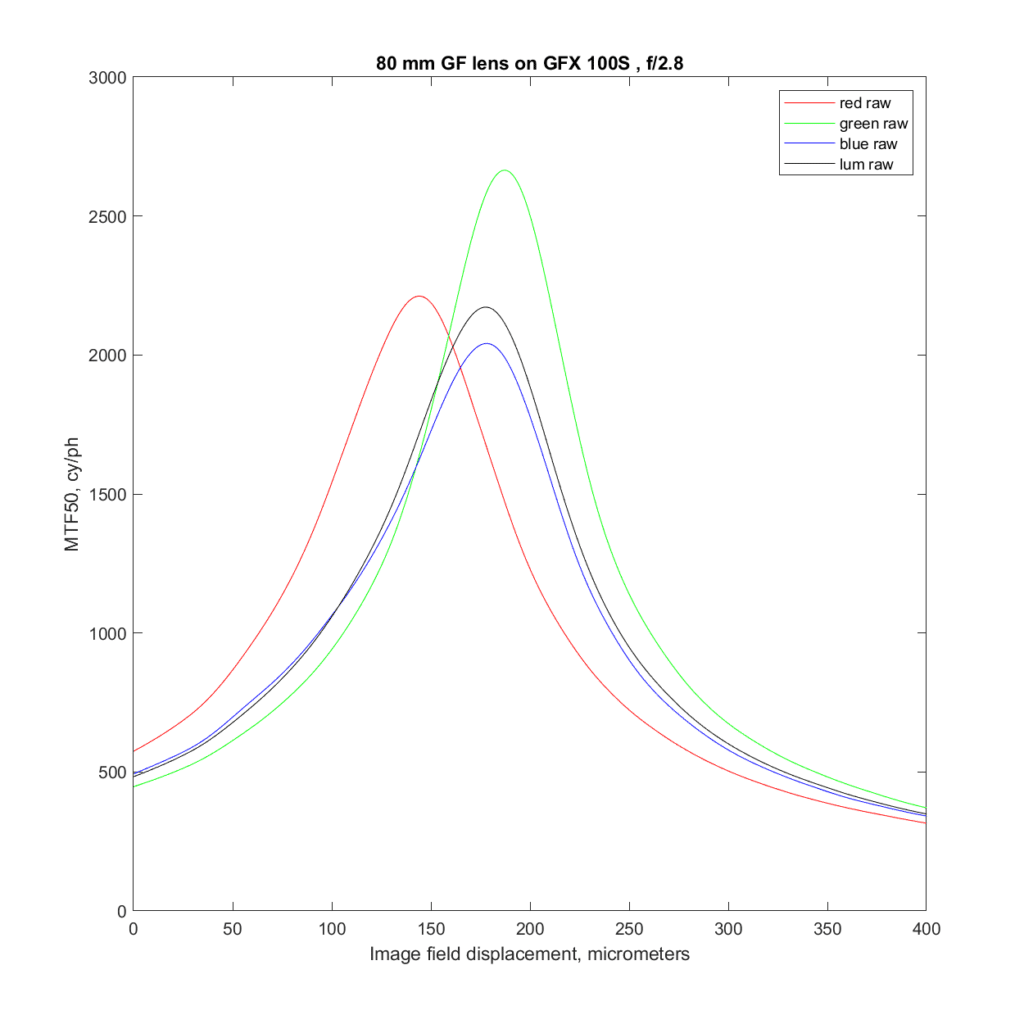
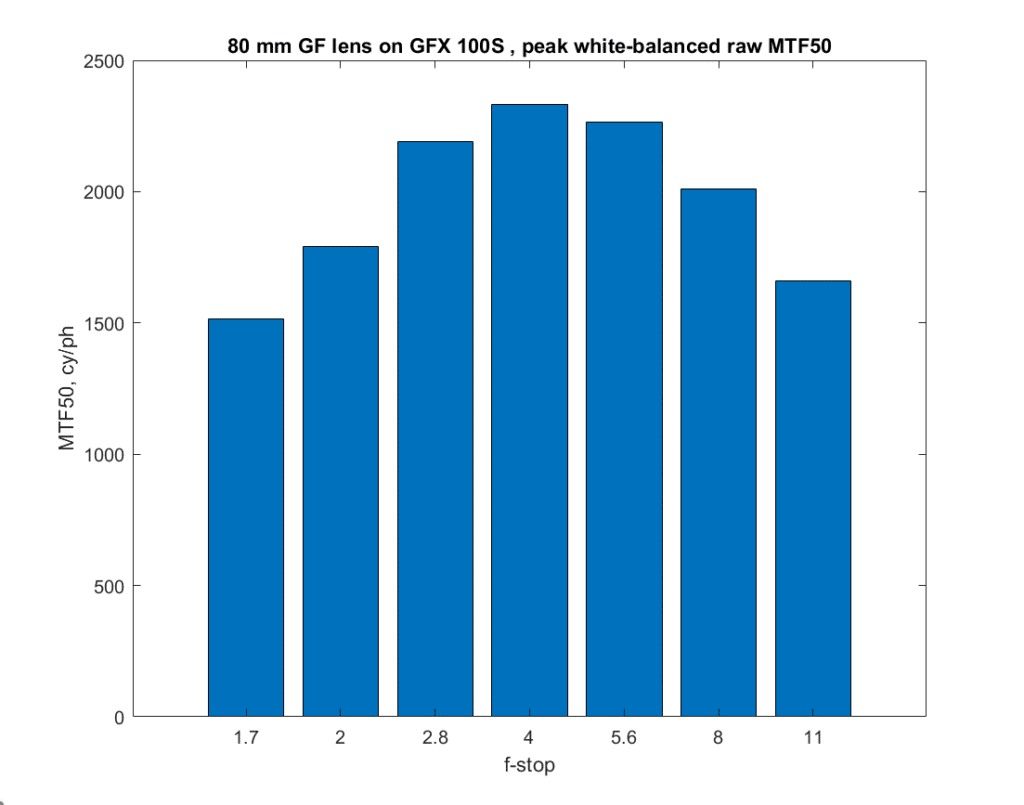
The white balanced raw line in black has finally peaked at over 2000 cycles per picture height.
The sharpness is still improving.
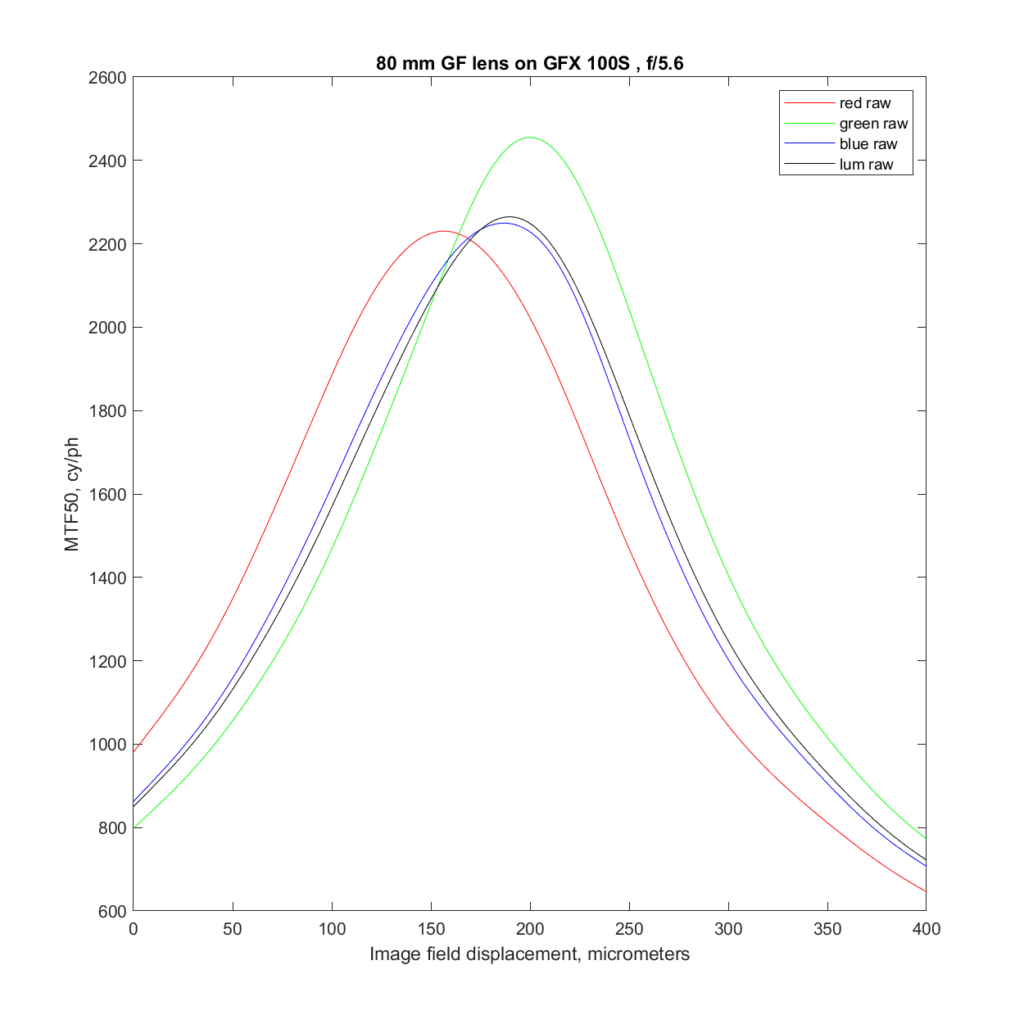
At f/5.6, the LoCA is getting under control, but overall sharpness has started to decrease.
Diffraction is having a significant effect, but less at the shorter (blue) wavelengths, as physics said should be the case.
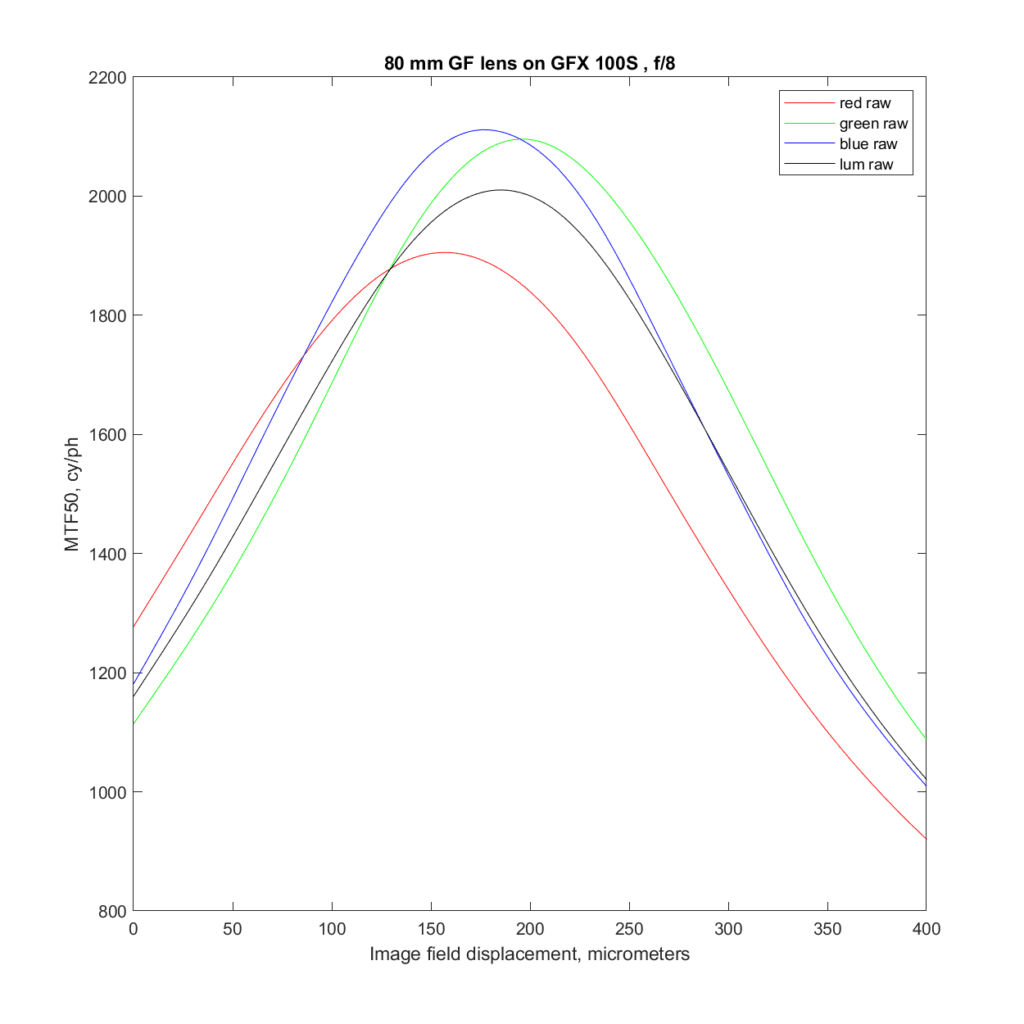
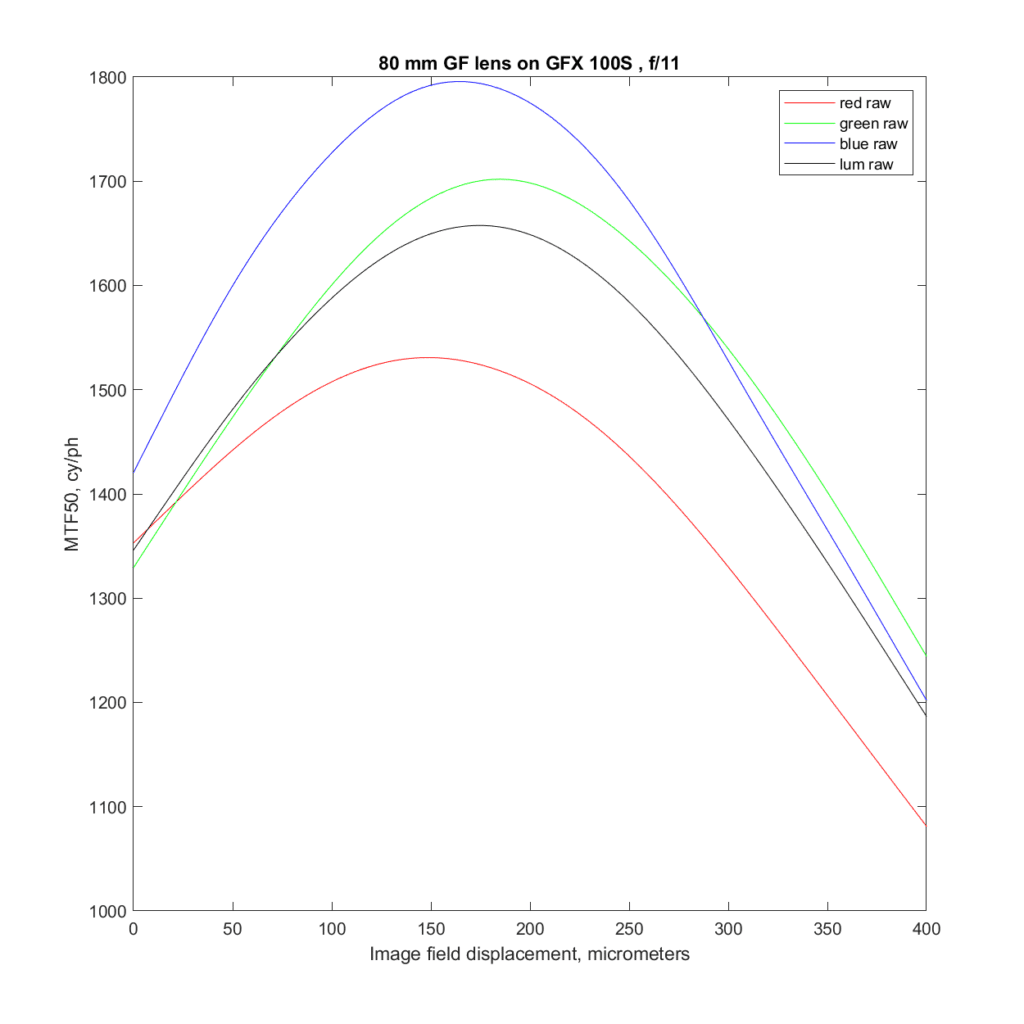
Now it’s all about diffraction.
Here are the peak white-balanced raw MTF50s in cy/ph at each of the stops tested:
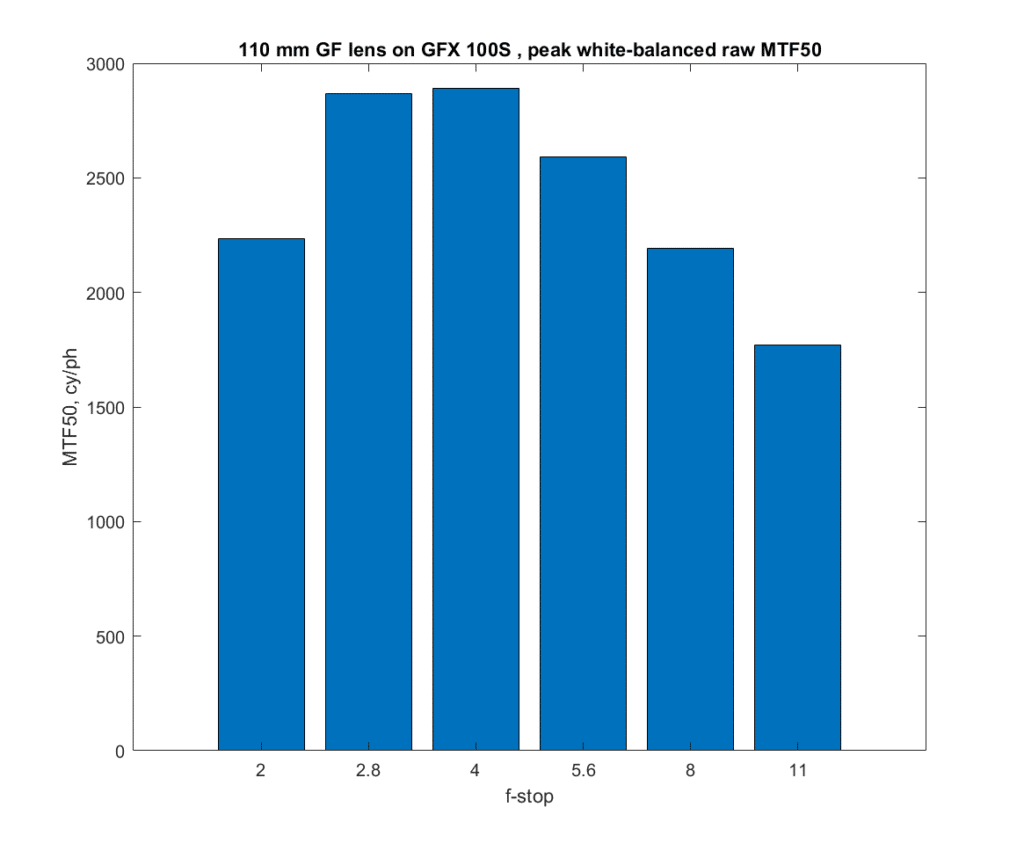
And here is the same plot for the 110/2:
The 110 is a substantially sharper lens.
Here is a chart showing the LoCA of the 80/1.7 in terms of displacement of the image field distance along the lens axis with respect to the white-balanced raw metric:
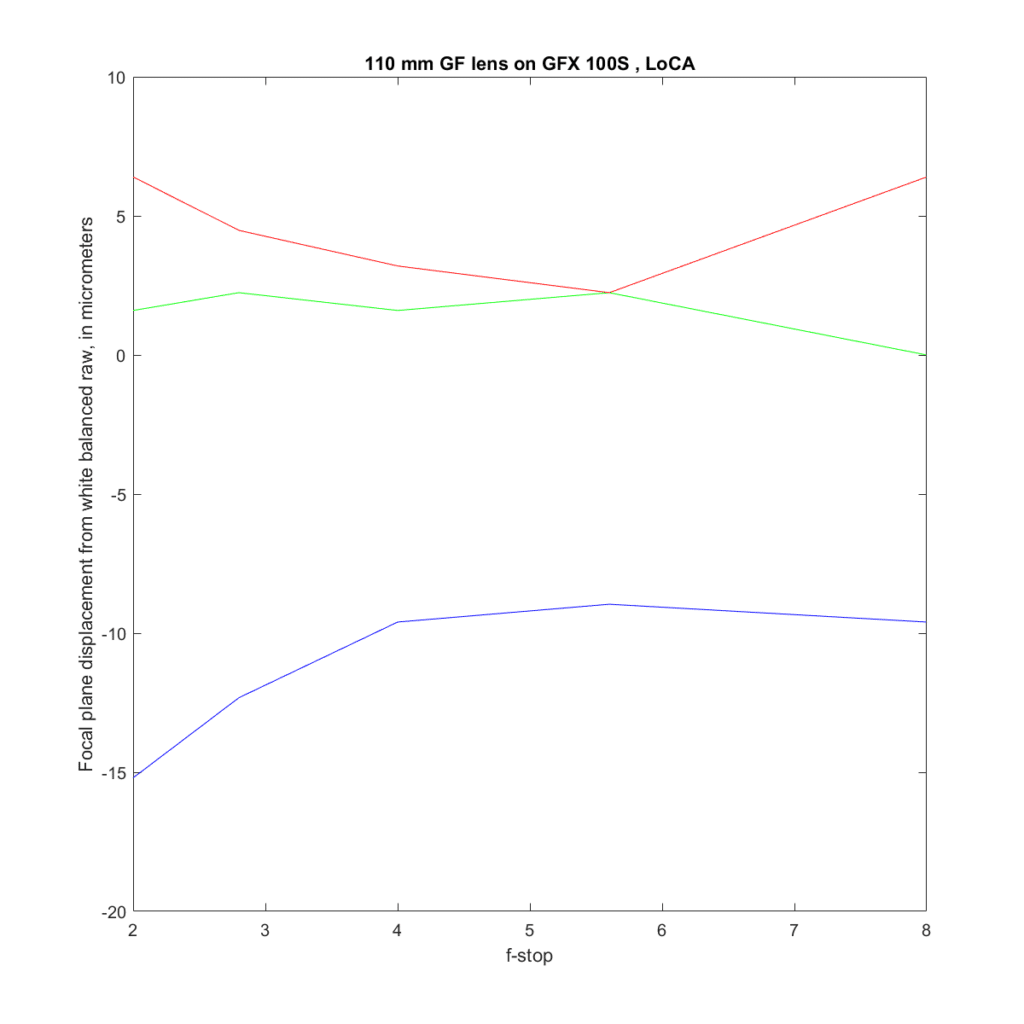
And here is the same chart for the 110/2:
The 110 has substantially less LoCA.
It’s a good thing that the 80/1.7 has other virtues than the ones I’m measuring here.
Leave a Reply