This is one in a series of posts on the Fujifilm GFX 100S. You should be able to find all the posts about that camera in the Category List on the right sidebar, below the Articles widget. There’s a drop-down menu there that you can use to get to all the posts in this series; just look for “GFX 100S”. Since it’s more about the lenses than the camera, I’m also tagging it with the other Fuji GFX tags.
Over the past few weeks, I’ve been posting a lot of graphs comparing several lenses. Many of the differences have been small. I wondered what kind of repeatability the tests I’m doing have. Are many of the small differences explained by noise in the test results?
I picked a difficult case. I put the Fujifilm 100 mm f/2 on a GFX 100S and set it to close to its best on-axis f-stop, f/4. I made 6 sets of 80 exposures, repicking the region of interest for each set in case small differences in the ROI produced meaningful variations in the results. I put all 6 sets through my usual number crunching.
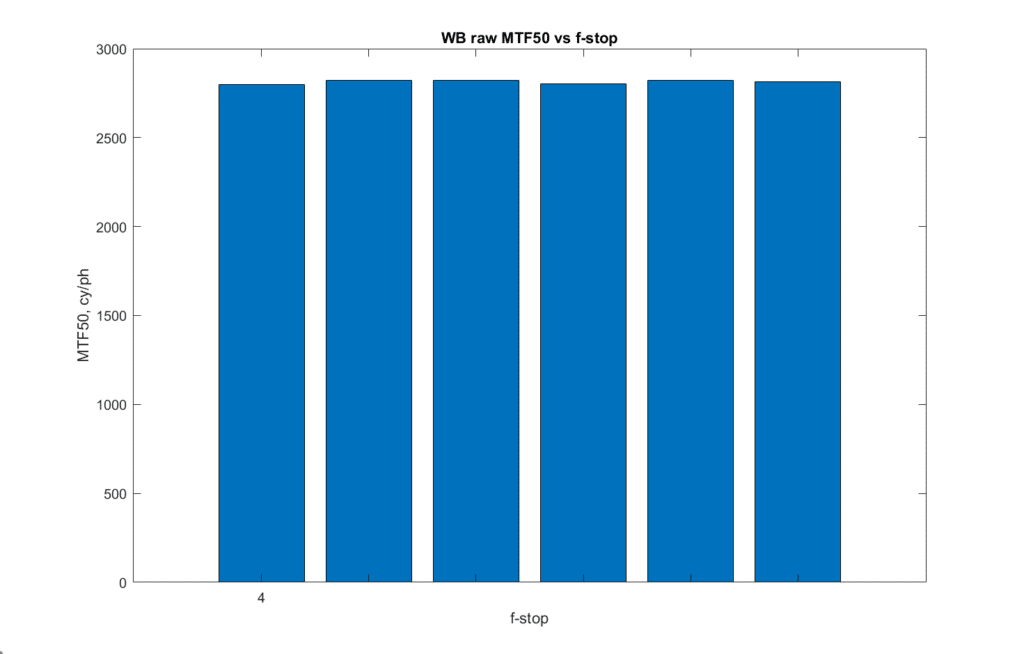
Here’s the MTF50 of the white-balanced raw channels.
Not much difference.
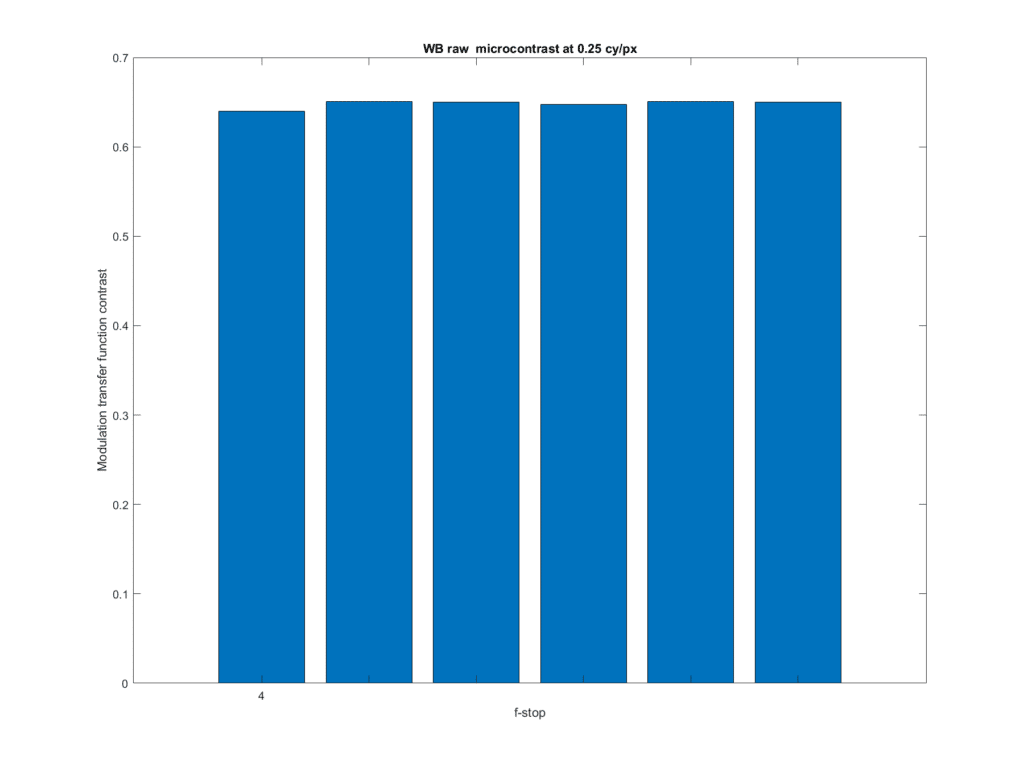
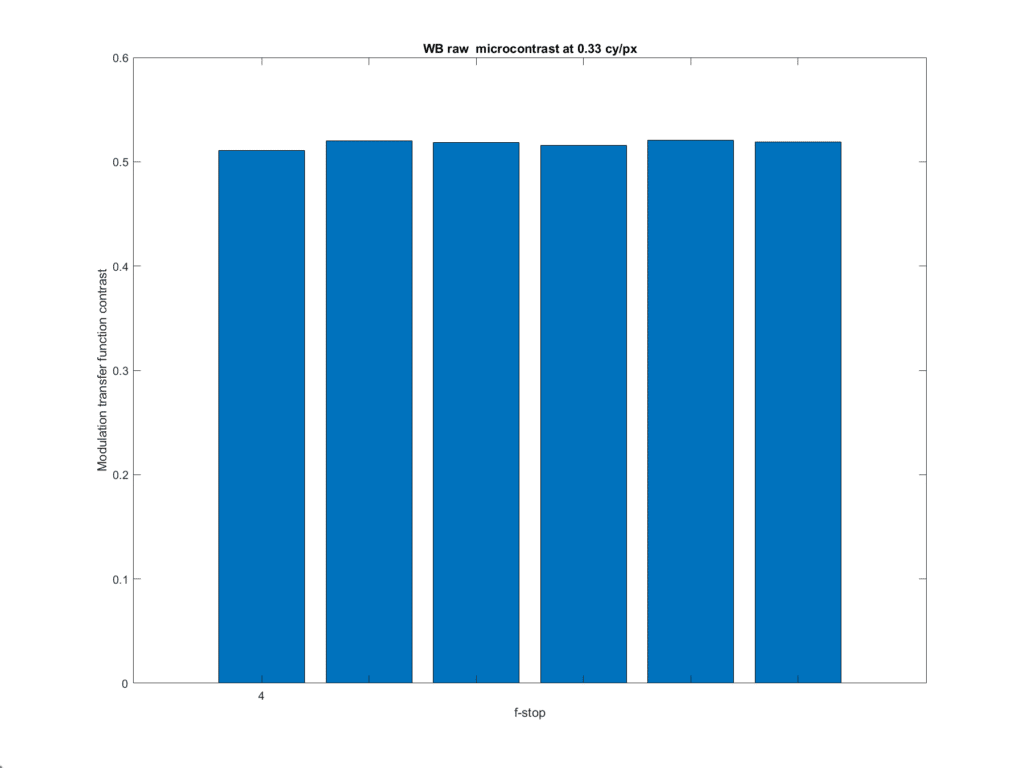
How about microcontrast?
Not much difference there, either.
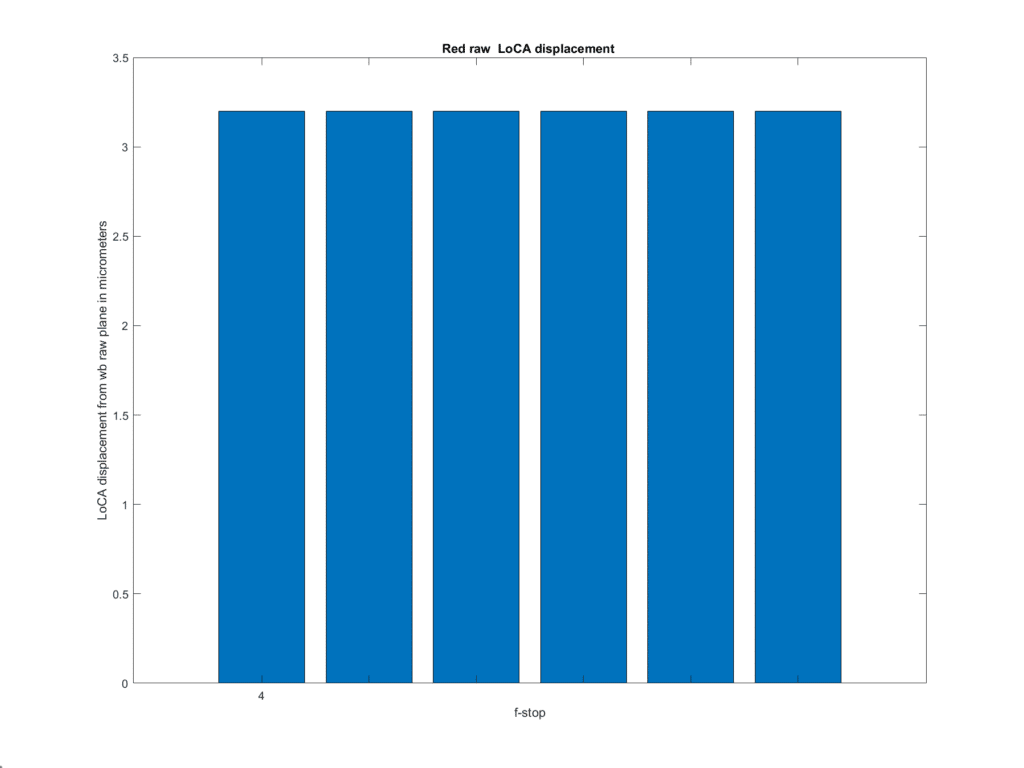
How about LoCA?
Not much difference for the red channel against the white-balanced result. Not much shift, either.
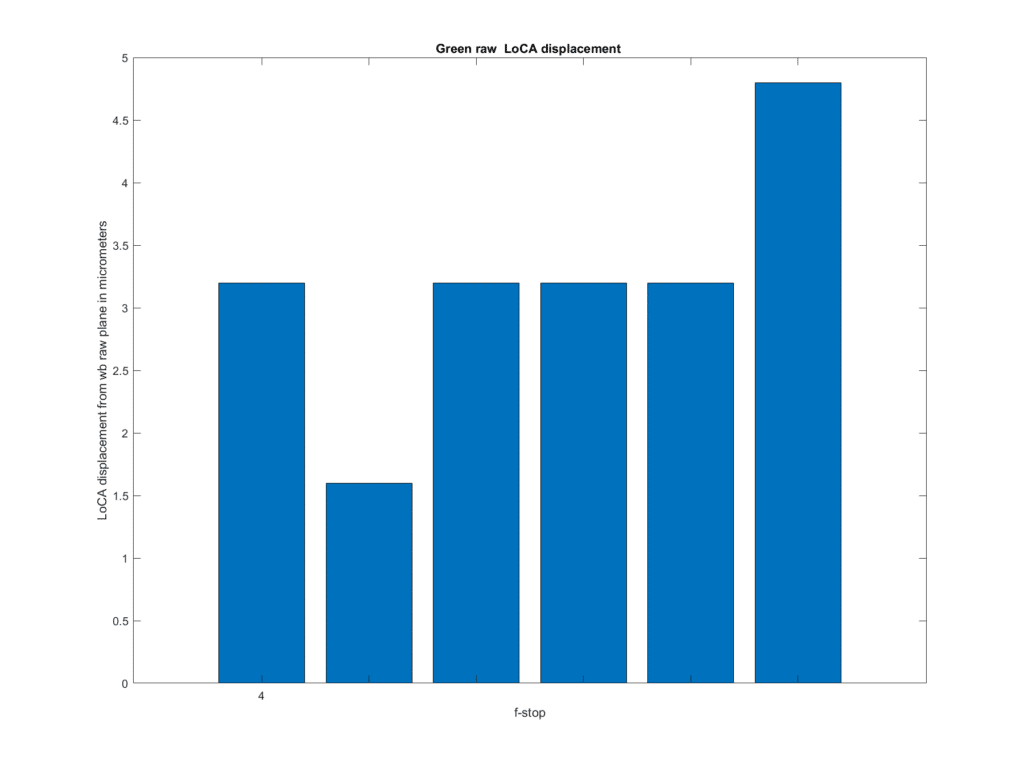
There’s more difference in the green LoCA plot.
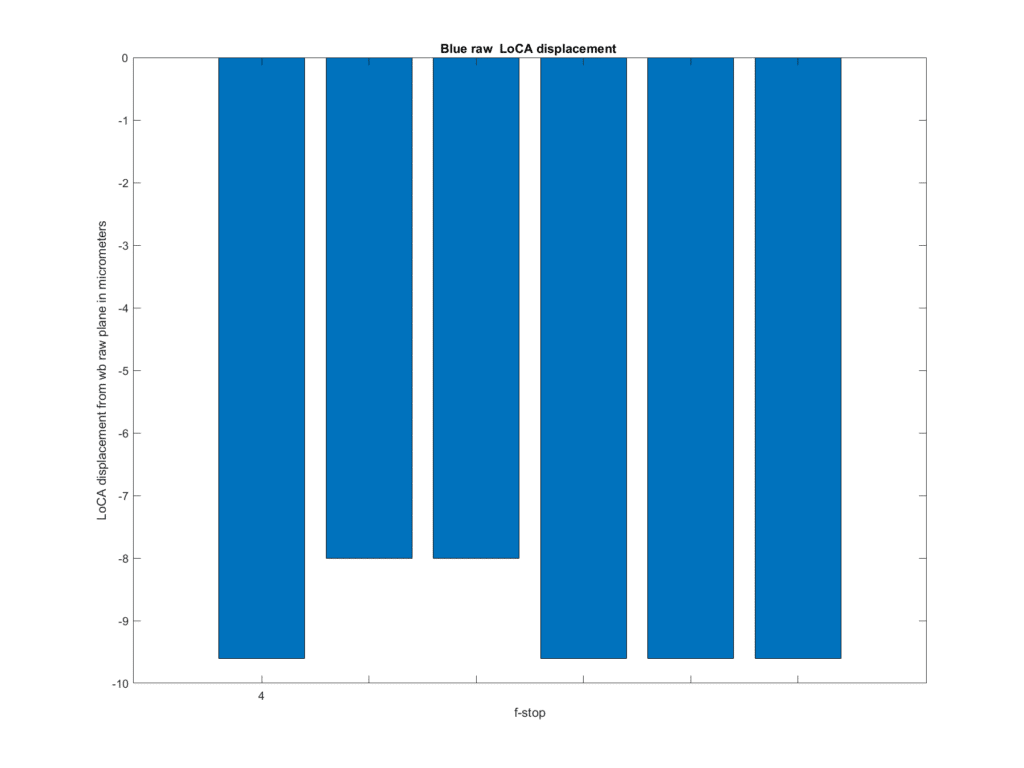
There’s a little variation in the blue LoCA graph.
If I were writing a scientific paper, I’d do a few hundred tests so that I could plot statistically-defensible error bars on my graphs. I’m not doing that, so, in the absence of something that makes me question the results, this is about all the work on repeatability You’re going to see.
Leave a Reply