• site home
  • blog home
  • galleries
  • contact
  • underwater
  • the bleeding edge

the last word

Photography meets digital computer technology. Photography wins -- most of the time.

You are here: Home / Leica Q2 Monochrom / Leica Q2 Monochrom highlights at ISO 100 — graphs

Leica Q2 Monochrom highlights at ISO 100 — graphs

May 24, 2022 JimK Leave a Comment

This is the 14th post in a series about the Leica Q2 Monochrom. You can see all the other posts in the series by looking in the Category List drop-down menu on the right side of the page.

I’ve been trying to get some quantitative results in my Leica Q2M ISO 100 highlight testing, and the results that I’ve been getting had me questioning my test protocol. So this morning I ran a series of tests that were intended to look at the highlight behavior at ISO 100, but also that at ISO 200 using the same protocol.

Using the RRS Q2 plate, I put the Q2M on a sturdy set of RRS carbon fiber legs using an Arca Swiss C1 head. I set the camera to ISO 400 and a quarter of a second. I adjusted the aperture to get mild clipping. Using the self-timer, I made an exposure. The I set the ISO to 200, the shutter speed to 1/2 second, and made another exposure. Finally I set the ISO to 100, the shutter to one second, and made still another exposure.

I extracted the raw images, normalized them to 16383, so that full scale was now one, downsampled them in  Matlab, added a gamma 2.2 tone curve, and here’s what they look like:

ISO 100


ISO 200


ISO 400


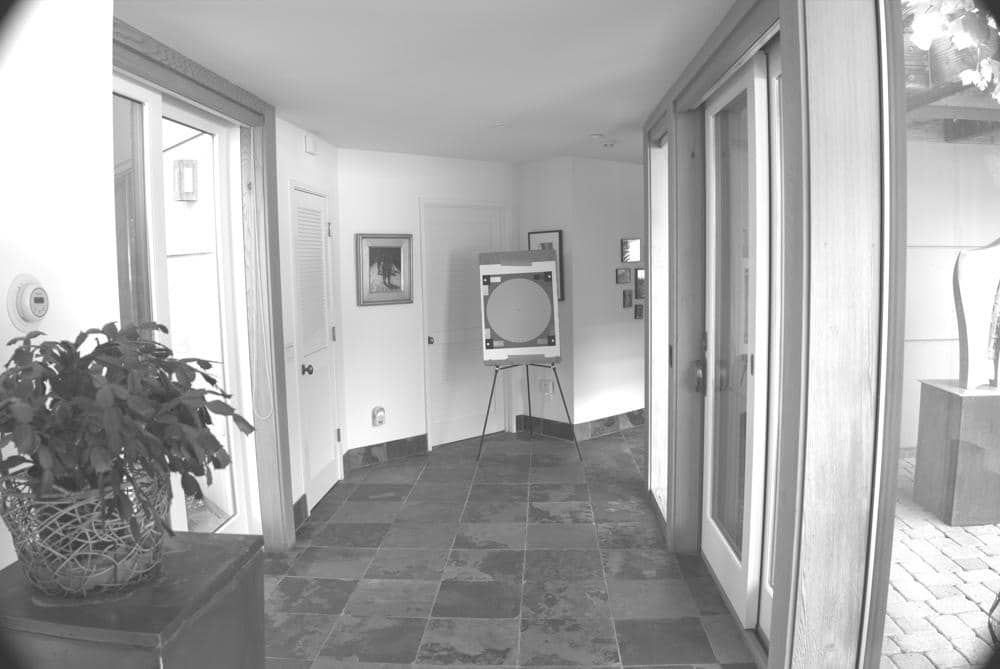
The suppression of the highlights in the ISO 100 image is quite visible.

Next was to make a scatter plot of all the pixels in the ISO 200 image on the y-axis, and all the pixels from the ISO 400 image on the x-axis.

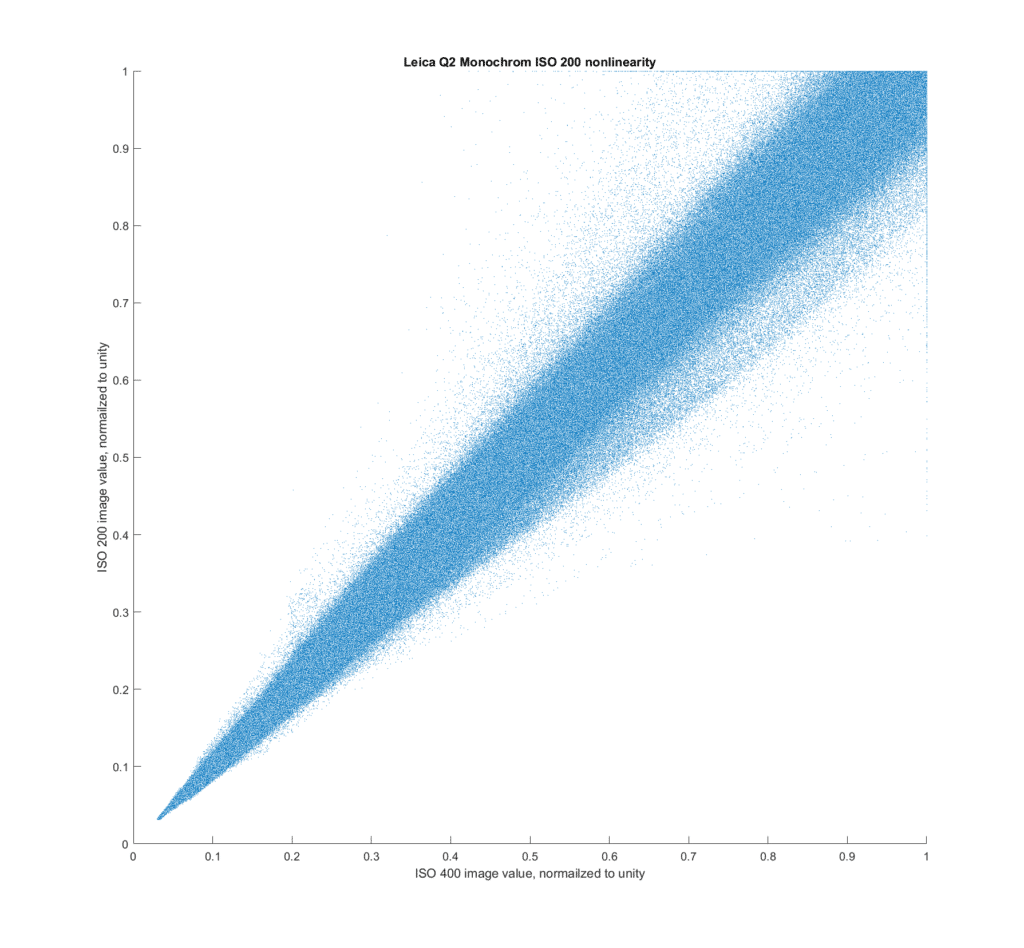
That looks about what I’d expect it to look like. The photon noise, which increases as the square root of the signal level, is responsible for the growing spread as the signal level increases. Applying a 400 by 400 pixel averaging kernel to both images filters out a lot of the photon noise, other noise, and noise due to alignment errors, and  yields:

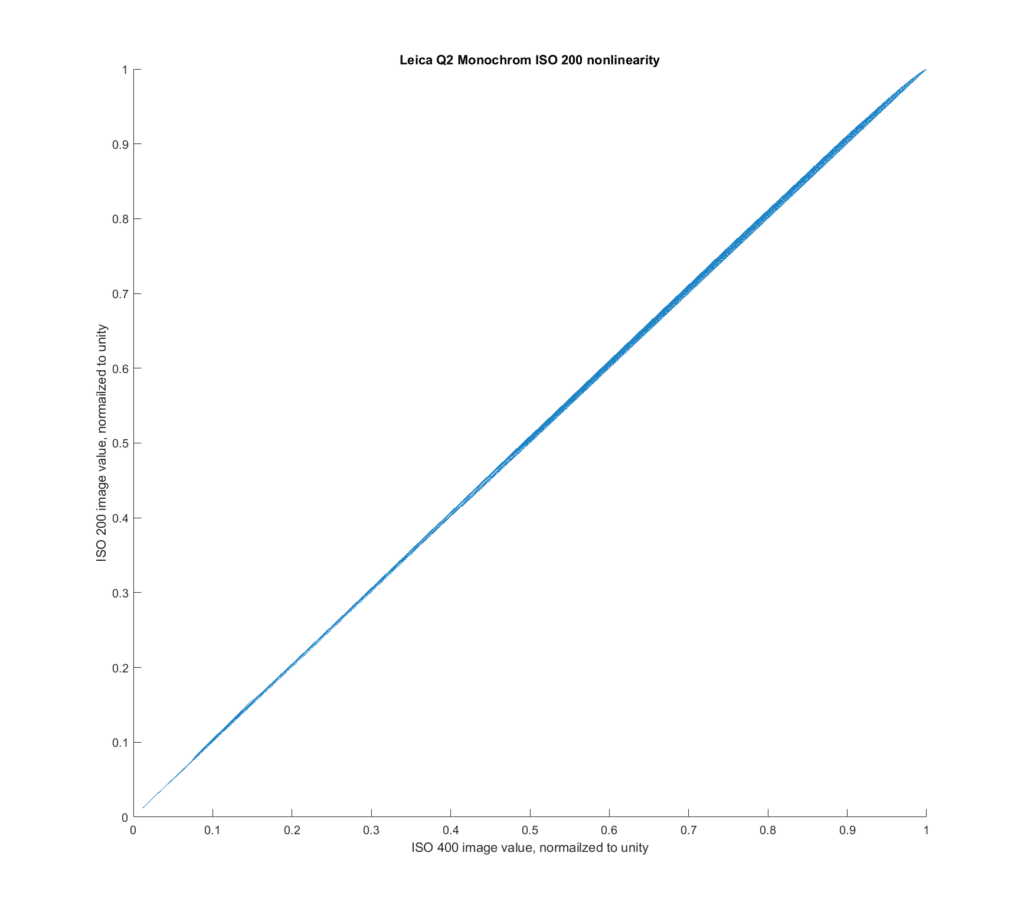
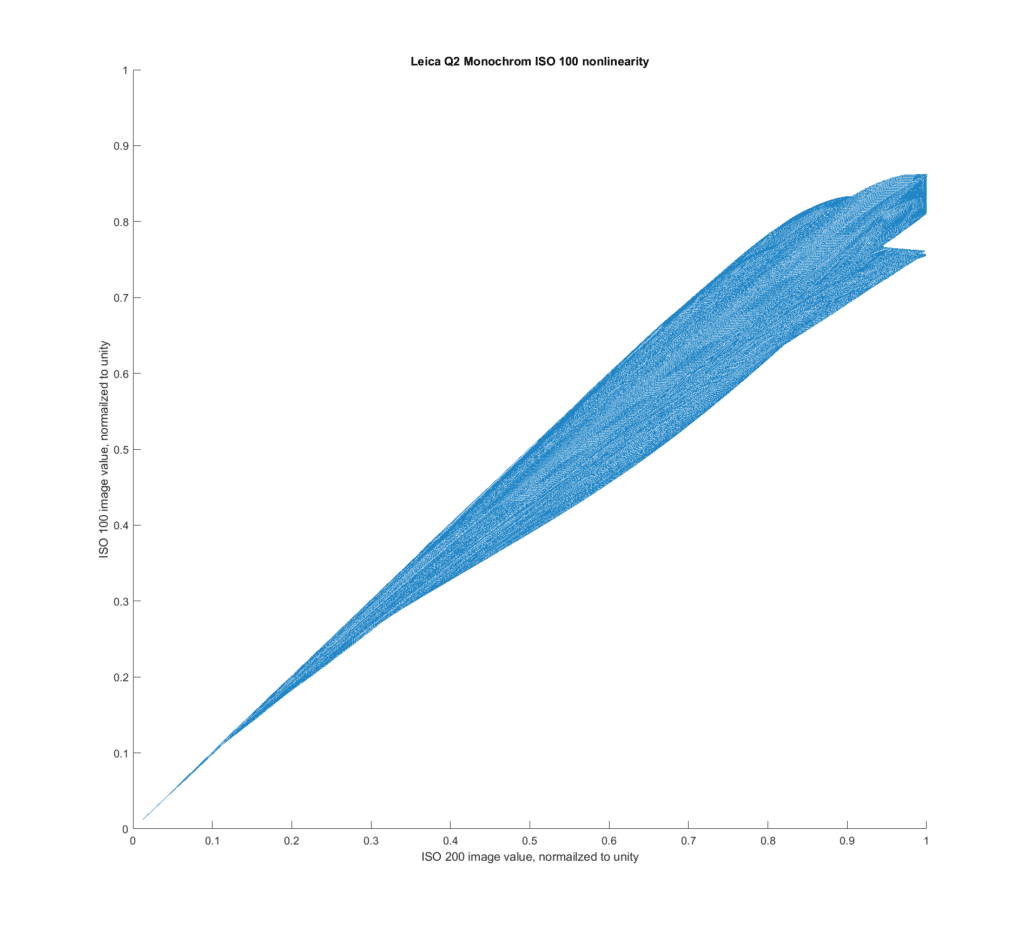
It looks like the methodology is good. Now I’ll plot the ISO 100 points on the y-axis and the ISO 200 points on the x-axis:

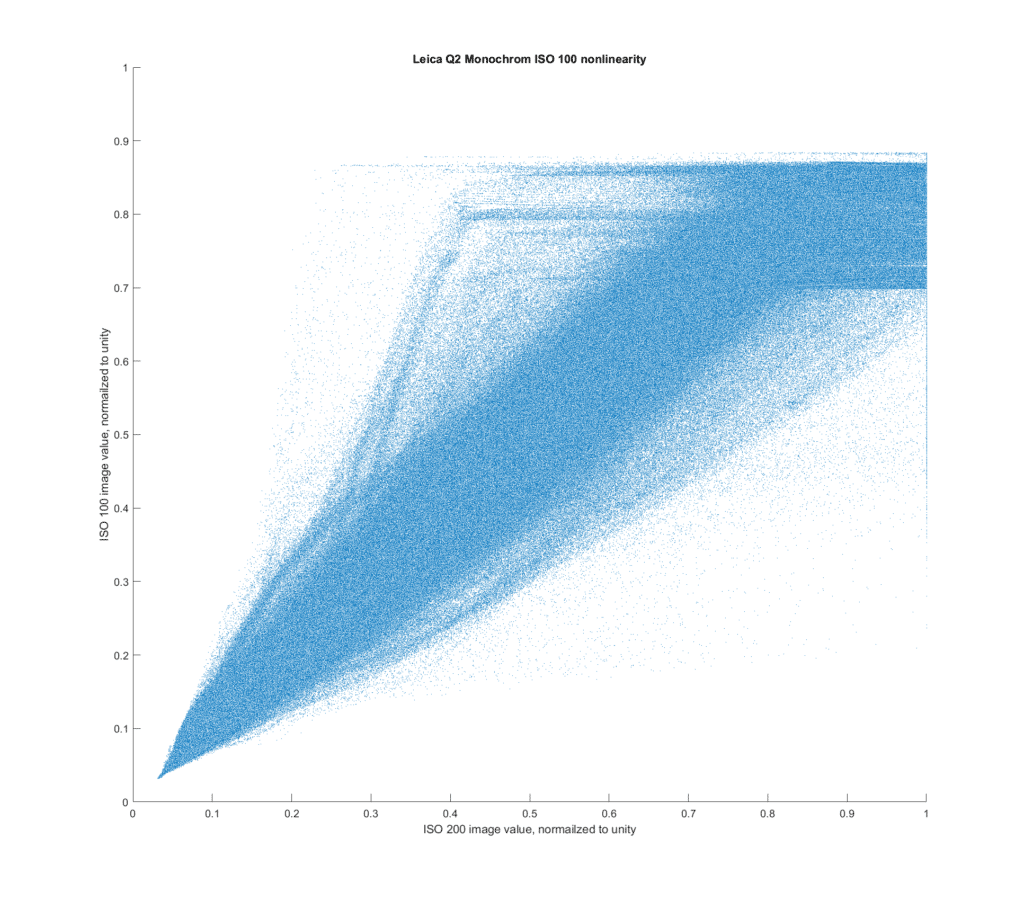
That is distinctly odd. It looks like clipping takes place at values between 0.7 and 0.88 of full scale. Depending on what?

Here is the result of applying the 400×400 kernel to both images:

I am now just as confused as before, but I am confused at a much higher level.

Leica Q2 Monochrom

← Leica Q2 highlights at ISO 100 — images Leica Q2 Monochrom highlights at ISO 100 — crops →

Leave a Reply Cancel reply

Your email address will not be published. Required fields are marked *

May 2025
S M T W T F S
 123
45678910
11121314151617
18192021222324
25262728293031
« Apr    

Articles

  • About
    • Patents and papers about color
    • Who am I?
  • How to…
    • Backing up photographic images
    • How to change email providers
    • How to shoot slanted edge images for me
  • Lens screening testing
    • Equipment and Software
    • Examples
      • Bad and OK 200-600 at 600
      • Excellent 180-400 zoom
      • Fair 14-30mm zoom
      • Good 100-200 mm MF zoom
      • Good 100-400 zoom
      • Good 100mm lens on P1 P45+
      • Good 120mm MF lens
      • Good 18mm FF lens
      • Good 24-105 mm FF lens
      • Good 24-70 FF zoom
      • Good 35 mm FF lens
      • Good 35-70 MF lens
      • Good 60 mm lens on IQ3-100
      • Good 63 mm MF lens
      • Good 65 mm FF lens
      • Good 85 mm FF lens
      • Good and bad 25mm FF lenses
      • Good zoom at 24 mm
      • Marginal 18mm lens
      • Marginal 35mm FF lens
      • Mildly problematic 55 mm FF lens
      • OK 16-35mm zoom
      • OK 60mm lens on P1 P45+
      • OK Sony 600mm f/4
      • Pretty good 16-35 FF zoom
      • Pretty good 90mm FF lens
      • Problematic 400 mm FF lens
      • Tilted 20 mm f/1.8 FF lens
      • Tilted 30 mm MF lens
      • Tilted 50 mm FF lens
      • Two 15mm FF lenses
    • Found a problem – now what?
    • Goals for this test
    • Minimum target distances
      • MFT
      • APS-C
      • Full frame
      • Small medium format
    • Printable Siemens Star targets
    • Target size on sensor
      • MFT
      • APS-C
      • Full frame
      • Small medium format
    • Test instructions — postproduction
    • Test instructions — reading the images
    • Test instructions – capture
    • Theory of the test
    • What’s wrong with conventional lens screening?
  • Previsualization heresy
  • Privacy Policy
  • Recommended photographic web sites
  • Using in-camera histograms for ETTR
    • Acknowledgments
    • Why ETTR?
    • Normal in-camera histograms
    • Image processing for in-camera histograms
    • Making the in-camera histogram closely represent the raw histogram
    • Shortcuts to UniWB
    • Preparing for monitor-based UniWB
    • A one-step UniWB procedure
    • The math behind the one-step method
    • Iteration using Newton’s Method

Category List

Recent Comments

  • JimK on How Sensor Noise Scales with Exposure Time
  • Štěpán Kaňa on Calculating reach for wildlife photography
  • Štěpán Kaňa on How Sensor Noise Scales with Exposure Time
  • JimK on Calculating reach for wildlife photography
  • Geofrey on Calculating reach for wildlife photography
  • JimK on Calculating reach for wildlife photography
  • Geofrey on Calculating reach for wildlife photography
  • Javier Sanchez on The 16-Bit Fallacy: Why More Isn’t Always Better in Medium Format Cameras
  • Mike MacDonald on Your photograph looks like a painting?
  • Mike MacDonald on Your photograph looks like a painting?

Archives

Copyright © 2025 · Daily Dish Pro On Genesis Framework · WordPress · Log in

Unless otherwise noted, all images copyright Jim Kasson.