This is a continuation of a test of the following lenses on the Sony a7RII:
- Zeiss 85mm f/1.8 Batis.
- Zeiss 85mm f/1.4 Otus.
- Leica 90mm f/2 Apo Summicron-M ASPH.
- AF-S Nikkor 85mm f/1.4 G.
- Sony 90mm f/2.8 FE Macro.
The test starts here.
I’ve so far been unsuccessful in measuring longitudinal chromatic aberration (LoCA) directly. I can measure on-axis color fringing, but that’s not a good proxy for LoCA, which occurs when the lens brings different wavelength light to a focus at different distances from the lens.
I reasoned that one way to measure LoCA directly might be to make a series of measurements with the camera a precisely controlled varying distances from the target, and analyzing the MTF50 for each output color plane, either before or after conversion to a standard color space. If the point of maximum MTF50 occurred at different distances, that would be prima facie evidence of LoCA. The distances between the best MTF50 points for the three color planes, suitably corrected for focal length and subject distance, would serve as a measure of the amount of LoCA present.
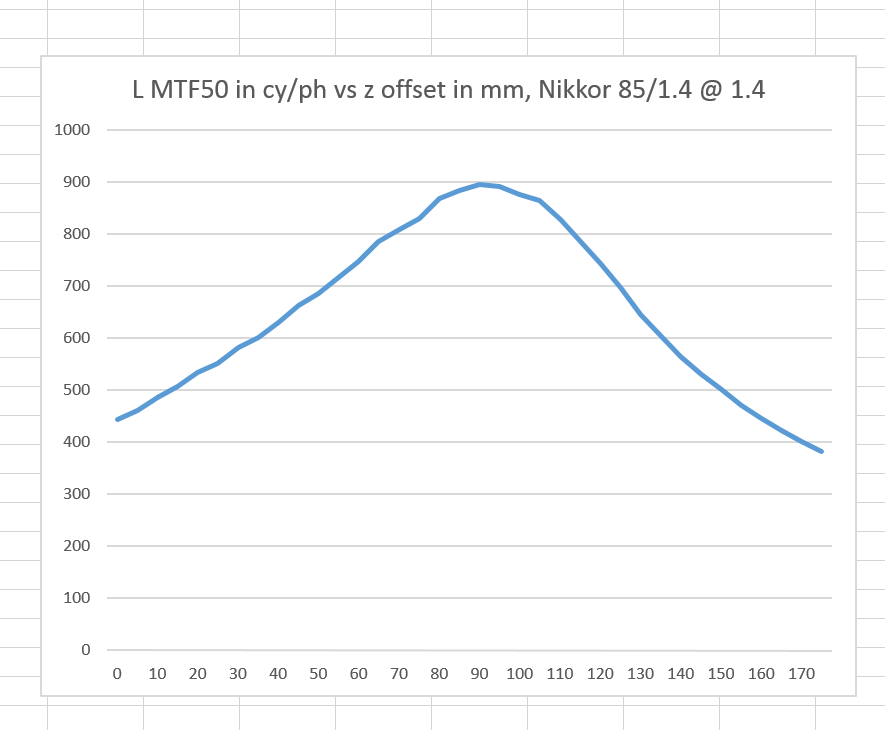
I mounted a Sony a7RIIto a Cognisys computer-driven focusing rail that I use sometimes for focus stacking. The rail has about eight inches of travel; I set the controller up to use 175mm of that. I set the assembly 3.3 meters from the target, mounted a Nikkor 85mm f/1.4 lens set to wide open, and made a set of images with the distance between images set to 5mm. I developed the set in DCRAW using the AHD demosaicing algorithm, and had it convert the files to 16-bit sRGB TIFFs. I told Imatest to do its magic, and plotted the luminance MTF50 values in cycles per picture height vs distance from the point furthest away from the target.
It would be nice to look at similar graphs for each color plane; that would give us the basis of the LoCA metric that we seek. Unfortunately, while it’s easy to feed Imatest a bunch of files and have it spit out a csv file with one column being luminance MTF50 and a row for each file, you can’t get three columns, one for the MTF50 in each color plane. You can get spreadsheets with those numbers, but each image gets its own spreadsheet, and assembling all those into one is going to take writing some code.
Imatest does have a utility that purports to find the sharpest file in a group — it actually produces an output rank-ordered by sharpness — and that utility says it will sort by luminance or any one of the three color planes, but any choice among the four alternatives produces the same result.
So, in the absence of code to crunch the individual spreadsheet detailed Imatest outputs, let’s look at some graphs and see how promising this technique might be.
First, near the luminance peak:
You can see that, if MTF50 is the criterion, the green channel is sharper than the luminance, the blue channel is worse, and the red channel is worse yet. If the contrast variation where the MTF is examined drops from 50%, things get even worse for the red channel.
Another sharpness measure is the number of pixels between the 10% and 90% points on the edge (lower is better), and Imatest calculates that for us. The green value is about a third of the red one.
Moving the camera 5 cm closer to the subject:
All three channels are fuzzier in SFR, all three 10%-90% risetime numbers are worse, and the relationship among the three color planes is unchanged.
At 50cm further away from the subject than the first plot, we see this:
The red channel is sharper than it was in the first plot, as indicated both by MTF50 and risetime. The same is true of the blue channel. The green channel is worse.
And here’s the sharpest image in the red channel, as measured by MTF50, with the camera another 20mm away from the subject than the image immediately above, or 70mm further away than the first image.:
Here’s the sharpest image in the blue channel, 25mm closer to the target than the first image :
And, as you might expect, the sharpest image in luminance is not the sharpest image in green. Here is the analysis of that image, which occurs 5mm closer to the target than the best image in luminance:
So, it looks like this technique might work. I’ll have to write some code first, though.
There’s another interesting thing that we can gain from looking at the three curves. The sharpest focus for luminance MTF50 is not the best focal point for color fringing; a farther focal point is better for that.


Leave a Reply