This is a continuation of a report on new ways to look at depth of field. The series starts here:
Some people think of blur in terms of CoC, others (like myself) in terms of MTF50. Is there a way to bridge the divide?
Indeed there is.
Translating between the two requires agreeing on some sensor characteristics. Let’s make it full frame, with a Bayer CFA. Let’s standardize on AHD for the demosaicing. Let’s say there’s no AA filter which makes the chip sharper than otherwise, and that there’s a 100% fill factor, which makes the chip softer than otherwise. Let’s look at a few different pixel pitches, starting with 4.5 um, which is the pitch of the Sony a7RII sensor, and getting coarser.
Now let’s look at the MTF50 readings we get when we project perfect circles of light of varying sizes on our simulated sensor.
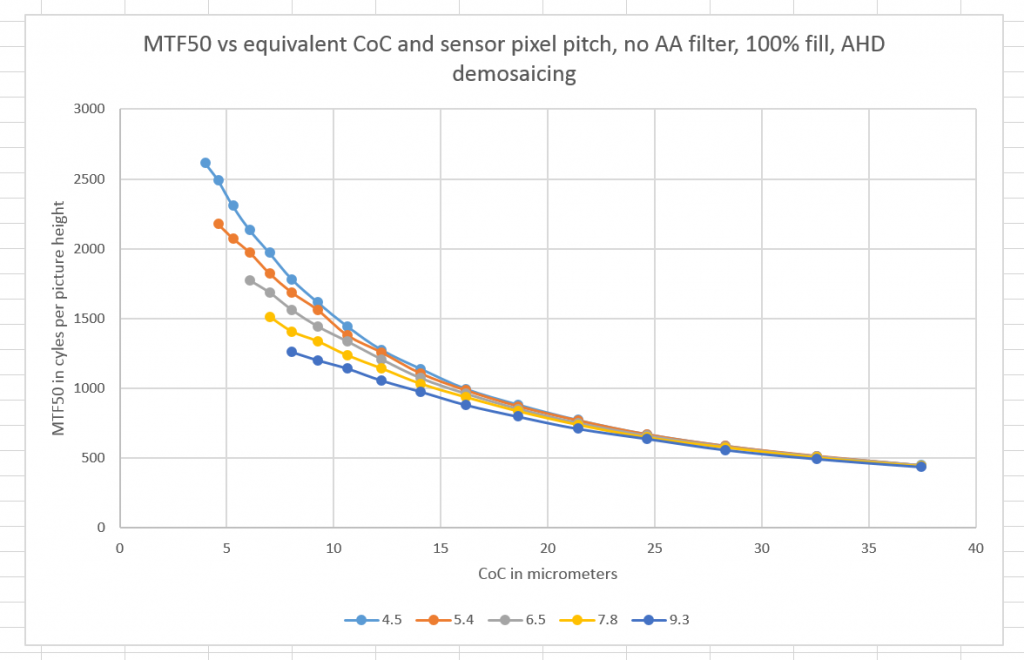
The vertical axis is MTF50 in cycles per picture height. The horizontal axis is the diameter of the CoC in micrometers. The curves identified in the bottom legend are pitches in micrometers.
You can see that the pitch doesn’t make much difference if the CoCs are large, but makes more and more difference as they get smaller.
So now you can go back and forth between an MTF50 value and its equivalent CoC. Let me emphasize that the CoC accounts for lens blur from all aberrations, diffraction, defocusing, camera motion blur, and any other kind of blur that affects the image hitting the sensor. In real life, all these blurs wouldn’t be modeled with a circular kernel (pillbox to image techies), but they are here.
Example: what’s the equivalent CoC diameter for a MTF50 of 1800 cy/ph (about the best we saw with our simulated lens in the previous couple of posts) on a Sony a7RII? About 8 um.
Here’s a set of similar curves, only with a beam-splitting antialiasing filter added with zeros at about 0.7 cycles per pixel in each direction:
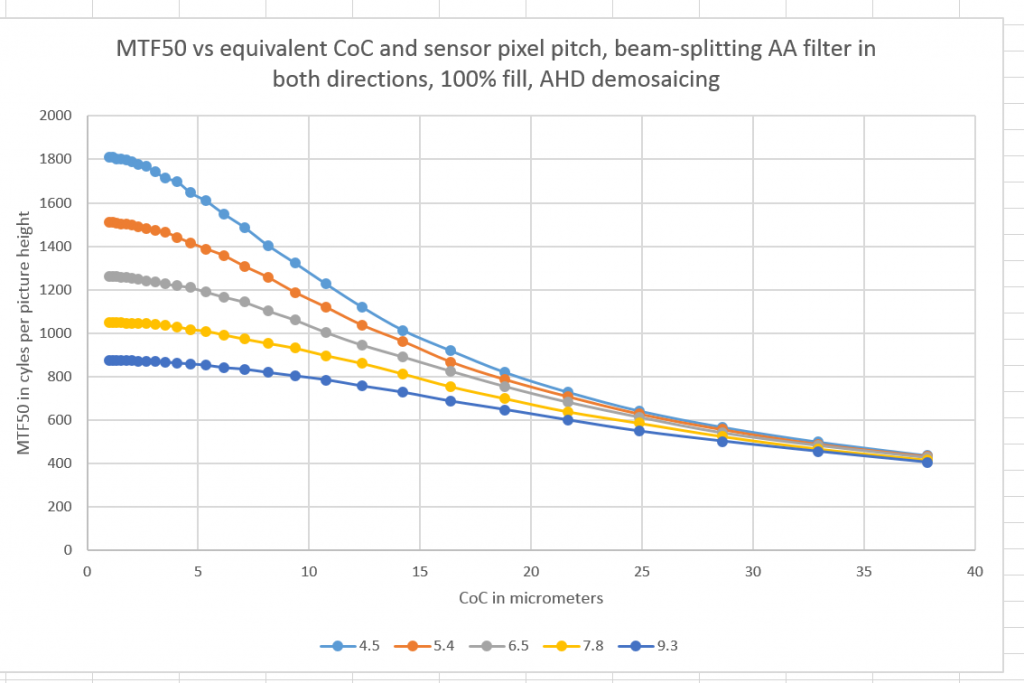
You can see that, even at 4.5 um pitch, very small CoCs eventually have reduced effect at increasing MTF50. However, note that the minimum CoC in the above plot is 1 um!
I had a series of questions on this post. I’ll try to answer them here.
The light-blue (top) curve is appropriate for the Sony a7RII?
That’s right. The a7RII has a 4.5 um pitch. Check. The a7RII has BSI and microlenses, so 100 fill factor makes sense. Check. The a7RII has a Bayer CFA. Check.
The few small changes in the sign of the second derivative of the curves—is that due to stochastic integration, your rounding before graphing, or something else?
It’s a combination of errors in the slanted edge software (I’m using sfrmat3),and inadequate scaling between the pre-sensor domain and sensor-sampled image data (I used a factor of 32 for this set of curves, which means there are about 1000 points of pre-sensor-sampling data for every sampled point; when is used a scaling factor of 16, the curves were rougher).
Would you be willing to offer intuition for the reason that these results vary by sensor pitch?
For small CoCs, finer sampling offers higher resolution. For big fiat CoCs, not so much. No matter how much resolution you give a blurry image field, you get a blurry result.
Why not extend the curves further to the left?
We get too close to the Nyquist frequency if we do that. MTF50s near Nyquist are not photographically useful, as they are too prone to aliasing and false color, and they’re hard to measure accurately with the slanted edge method.
How are you defining CoC for an electronic camera? I mean, for a film camera, we define CoC by assuming perfect film. But for an electronic camera, what are we making perfect (if anything) for the definition of CoC?
The CoC in the above graph is of the image as it appears on the microlens assembly/CFA over the sensor,. I’m considering any blur introduced by the cover glass in the sensor stack to be part of the lens. Sampled image sharpness is impacted by the Bayer CFA and fill factor.
Actually, I’m even more confused about the role of a Bayer array. How does that affect CoC?
The CoC is measured just above the CFA/microlens assembly, and just under the IR-absorbing glass in the sensor stack..
Are you assuming white light, perhaps?
D65 light, and a D65 CFA. Diffraction is calculated at three discrete wavelengths, though.
Now I would imagine that smaller CoCs at the image plane are better (i.e., more desirable) regardless of sensor pitch. Do you agree?
There are many schools of thought on that, depending on how the person arguing for method A values sharpness versus freedom from aliasing. In space-based earth imaging systems for example, the have a concept of image Q which balances the two. You can read about it here. In those systems, it is common to sample more finely with respect to lens resolution than we do in our cameras today.
Leave a Reply