Yesterday I posted raw histograms from the Nikon D810 and D800E that showed that Nikon performed aggressive black-level subtraction in the D800E files, while there was very little clipping of the left side of the histogram in most cases with the D810.
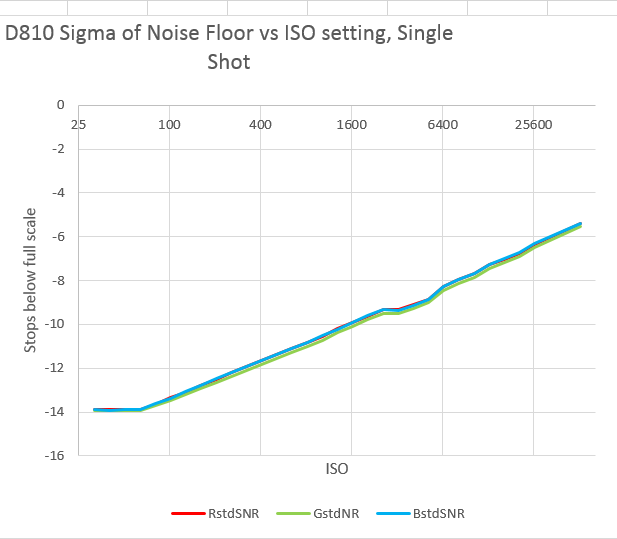
The conventional quick way to measure dark-field noise is to compute the ratio of full-scale to the standard deviation (aka sigma) of the measured dark field noise in the raw files. When you do that with the D810, you get this:
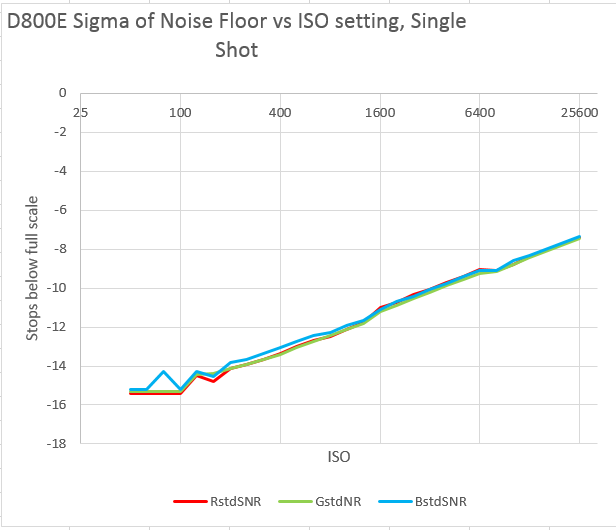
With the D800E, the curve looks like this:
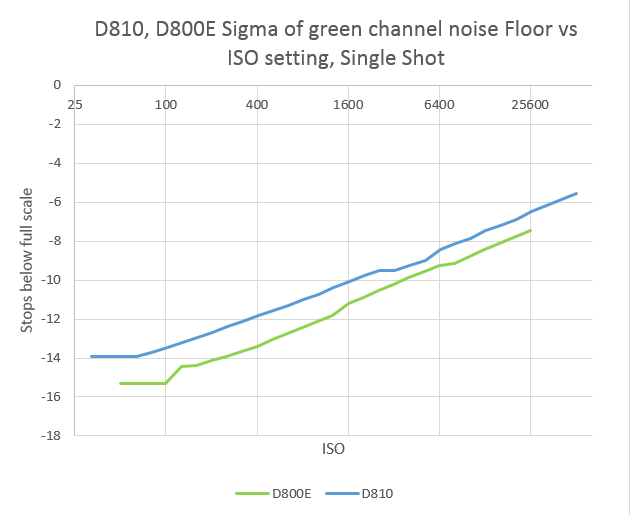
Putting both curves on the same graph, and leaving out the blue and red channels for clarity:
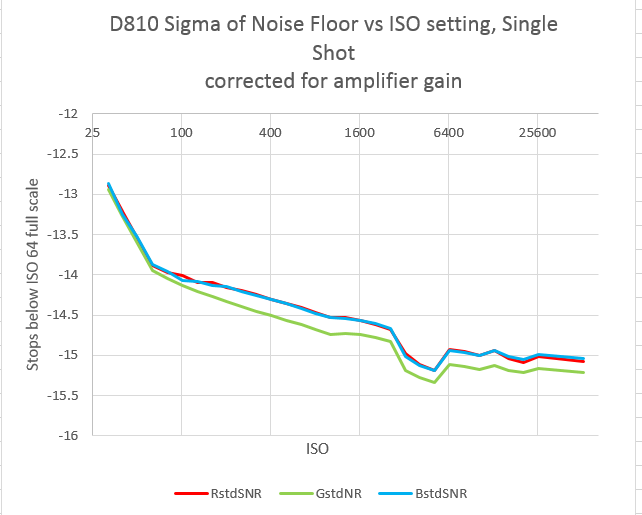
If you correct for amplifier gain, so the noise is referred to the input of the internal amplifiers, the D810 curve looks like so:
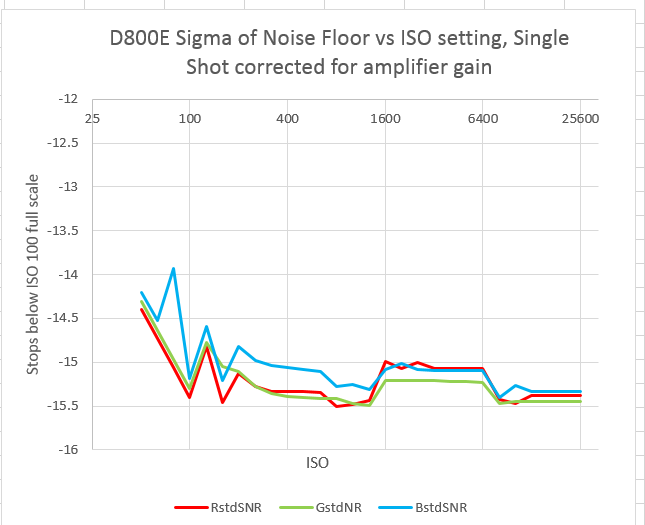
And the D800E curve is:
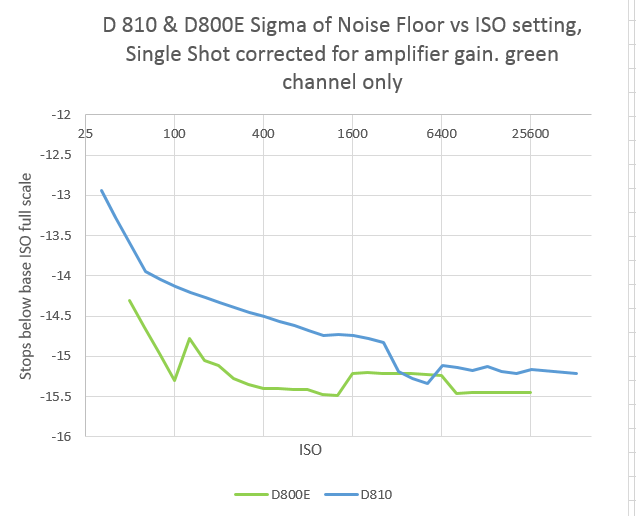
If we plot the green channels of the two cameras on the same graph, we get this:
You’ve probably seen graphs like the above on the ‘net, albeit probably not with 1/3 stop ISO resolution. They make it look like the D810 is a step backwards in terms of read noise, except for a few ISO settings at 3200 and above for the D810.
That’s because the cameras play by different rules. The D800E’s internal subtraction of the black level makes the camera’s dark-field noise look better than it really is.
There’s another way to get at read noise. It involves making a series of measurements at ever-decreasing illumination of a target, fitting a curve to the result, and extrapolating it to zero signal. Such methods need to be employed to compare two cameras with such dissimilar raw processing as the D810 and D800E, and even they require some guesswork.
HF says
Hello,
could this internal subtraction of the black level be the reason
for possible thermal noise differences between D810 and D800E as described here:
http://photographylife.com/nikon-d810-thermal-noise-issue ?