• site home
  • blog home
  • galleries
  • contact
  • underwater
  • the bleeding edge

the last word

Photography meets digital computer technology. Photography wins -- most of the time.

You are here: Home / The Last Word / Histogram depopulation in image editing, part 2

Histogram depopulation in image editing, part 2

May 22, 2012 JimK Leave a Comment

In 1991, I noted the phenomenon that Wells calls combing, came up with a few ways to artfully trade off image resolution for reduction or elimination of the effect, and submitted a patent disclosure to my employer. They weren’t interested in patenting the ideas, but instead published it in order to keep anyone else from patenting them.

In those days images were coded with far less precision than today. We will see in the next post how that makes a huge difference.

In the processing of photographic or photorealistic images, the image information is usually represented in fixed point form, using a number of bits for each color plane (or for the greyscale information, in the case of a monochromatic image) that is adequate for sufficiently accurate representation of the image information in the final form.  In the nineties and early years of this millennium, monochromatic images were often represented using one byte (eight bits) per pixel, allowing the representation of 256 shades of grey, barely enough to prevent visible banding or contouring in image areas with high energy at low spatial frequencies and low energies at high spatial frequencies.  Color images were often represented using three bytes per pixel, one byte for each color plane.

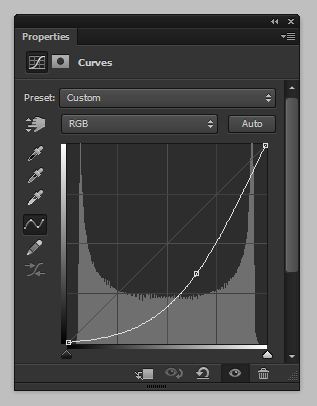
Many operations in image processing involve subjecting every pixel in the image to computational process to produce a new value for that pixel.  If, for every pixel in the image, only that pixel and the algorithm influence the result, this kind of processing as called point processing, and the algorithm is referred to as a point process.  An example of a point process is changing the brightness of an image through the levels or curves tools.  In the case of a monochromatic image represented with one byte per pixel, lowering the brightness of an image without changing either the white or black points using conventional methods involves passing every pixel in the image through an algorithm with a transfer function similar to one shown below.

Such a function has a slope of less than unity for dark pixels, and a slope of greater than one for bright pixels.  For the dark pixels, there will be more than one input value mapped to some output values, and for the light pixels, there will be some values which are not present in the output image, no matter what the input values.  Consider an image that has a more-or-less uniform histogram, shown below.

Passing this image through the transfer function above yields the histogram below.

Note the absence of certain codes in the histogram.  I call this phenomenon “histogram depopulation.” Wells calls it histogram “combing”.

Histogram depopulation cannot be corrected by subsequent conventional point processing.  The following  shows the histogram of the image that results from passing the test image through two complementary curves, one similar to the concave upward one above, and the other concave downwards.

If it were not for histogram depopulation, the completely populated histogram of the original image would result.  Although the codes that were eliminated in the parts of the darkening transfer function that have a slope of greater than one are mapped back to their original locations by the inverse operation, the inverse operation has slope greater than one in the dark areas, causing additional codes to lack representation.

Histogram depopulation occurs whether you’re lightening or darkening images. If you’re using any curve that has a slope of greater than one in any region, histogram depopulation will occur in that region.
 

The Last Word

← Histogram depopulation in image editing, part 1 Histogram depopulation in image editing, part 3 →

Leave a Reply Cancel reply

Your email address will not be published. Required fields are marked *

May 2025
S M T W T F S
 123
45678910
11121314151617
18192021222324
25262728293031
« Apr    

Articles

  • About
    • Patents and papers about color
    • Who am I?
  • How to…
    • Backing up photographic images
    • How to change email providers
    • How to shoot slanted edge images for me
  • Lens screening testing
    • Equipment and Software
    • Examples
      • Bad and OK 200-600 at 600
      • Excellent 180-400 zoom
      • Fair 14-30mm zoom
      • Good 100-200 mm MF zoom
      • Good 100-400 zoom
      • Good 100mm lens on P1 P45+
      • Good 120mm MF lens
      • Good 18mm FF lens
      • Good 24-105 mm FF lens
      • Good 24-70 FF zoom
      • Good 35 mm FF lens
      • Good 35-70 MF lens
      • Good 60 mm lens on IQ3-100
      • Good 63 mm MF lens
      • Good 65 mm FF lens
      • Good 85 mm FF lens
      • Good and bad 25mm FF lenses
      • Good zoom at 24 mm
      • Marginal 18mm lens
      • Marginal 35mm FF lens
      • Mildly problematic 55 mm FF lens
      • OK 16-35mm zoom
      • OK 60mm lens on P1 P45+
      • OK Sony 600mm f/4
      • Pretty good 16-35 FF zoom
      • Pretty good 90mm FF lens
      • Problematic 400 mm FF lens
      • Tilted 20 mm f/1.8 FF lens
      • Tilted 30 mm MF lens
      • Tilted 50 mm FF lens
      • Two 15mm FF lenses
    • Found a problem – now what?
    • Goals for this test
    • Minimum target distances
      • MFT
      • APS-C
      • Full frame
      • Small medium format
    • Printable Siemens Star targets
    • Target size on sensor
      • MFT
      • APS-C
      • Full frame
      • Small medium format
    • Test instructions — postproduction
    • Test instructions — reading the images
    • Test instructions – capture
    • Theory of the test
    • What’s wrong with conventional lens screening?
  • Previsualization heresy
  • Privacy Policy
  • Recommended photographic web sites
  • Using in-camera histograms for ETTR
    • Acknowledgments
    • Why ETTR?
    • Normal in-camera histograms
    • Image processing for in-camera histograms
    • Making the in-camera histogram closely represent the raw histogram
    • Shortcuts to UniWB
    • Preparing for monitor-based UniWB
    • A one-step UniWB procedure
    • The math behind the one-step method
    • Iteration using Newton’s Method

Category List

Recent Comments

  • JimK on Calculating reach for wildlife photography
  • Geofrey on Calculating reach for wildlife photography
  • JimK on Calculating reach for wildlife photography
  • Geofrey on Calculating reach for wildlife photography
  • Javier Sanchez on The 16-Bit Fallacy: Why More Isn’t Always Better in Medium Format Cameras
  • Mike MacDonald on Your photograph looks like a painting?
  • Mike MacDonald on Your photograph looks like a painting?
  • bob lozano on The 16-Bit Fallacy: Why More Isn’t Always Better in Medium Format Cameras
  • JimK on Goldilocks and the three flashes
  • DC Wedding Photographer on Goldilocks and the three flashes

Archives

Copyright © 2025 · Daily Dish Pro On Genesis Framework · WordPress · Log in

Unless otherwise noted, all images copyright Jim Kasson.