Beauty is in the mind of the beholder, so ’tis said. I guess ugliness must be as well. Maybe I’m on a fool’s mission, but I’d like to figure out a way to mathematically calculate the visual effect of read noise.
If you look at the histogram of dark-field noise for a digital camera, providing the firmware that creates the raw image hasn’t cut off the bottom, you’ll see something that looks approximately Gaussian, with a bit of over-representation in the upper regions.
However, it is widely believed that read noise is more damaging to image quality than a similar amount of Gaussian noise, because read noise usually forms a pattern with some regularity. The viewer detects that pattern, and it is more distracting than a similar amount of Gaussian noise.
That’s the theory, anyway. I thought I’d explore some of the details, and maybe come up with some kind of numerical description of how visually distracting read noise patterning is. Foreshadowing: I havn’t gotten there yet. The journey is the destination, though; join me on the journey.
Here’s the histogram of the central 512×512 pixels in one of the green channels of a Nikon D810 dark-field image made at 1/8000 second, ISO 12500, and high ISO noise reduction set to high:
The black point on this camera is 600, and the histogram is truncated a couple of hundred counts to the left of that. There is at least one pixel that is about 3000.
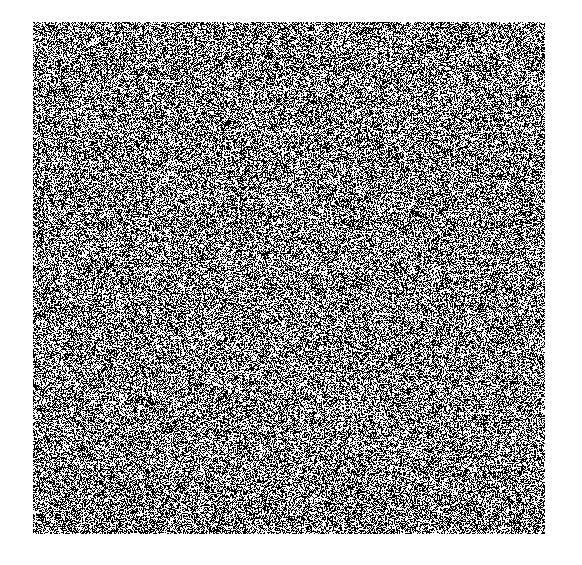
Here’s what the central 512×512 section looks like, with the black point subtracted out and scaled up in amplitude be a factor of 1000:
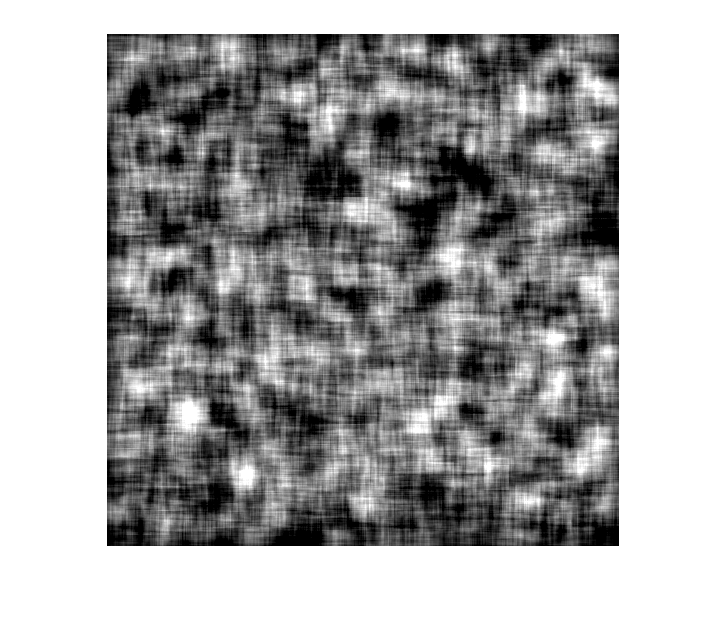
It looks like there is some kind of pattern, doesn’t it? The eye is really good at picking out patterns. Maybe too good it can make them up as well. Here’s a similar image of Gaussian noise — I haven’t matched the statistics:
Can you see mountains and plains? I can.
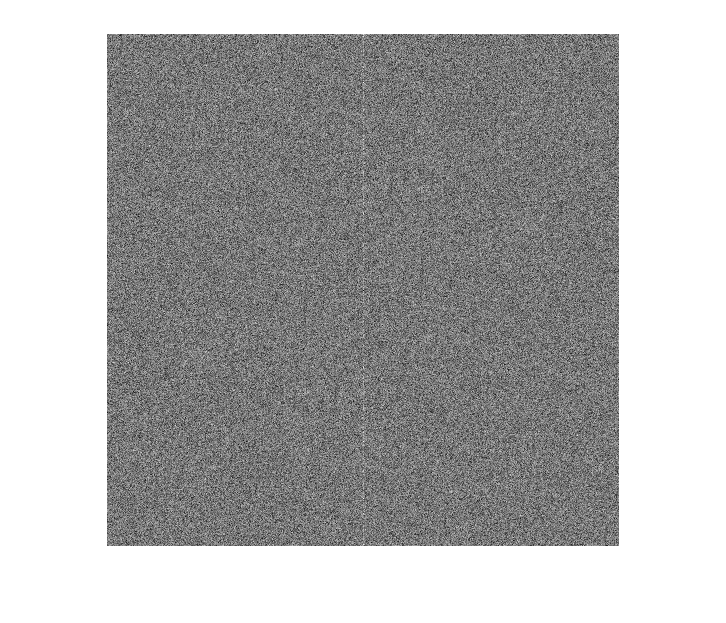
Many patterns are periodic. One way to find periodicities in images is to look at the Fourier transform. Here’s the magnitude of the Fourier transform of the 512×512 crop from the Nikon D810 dark field image:
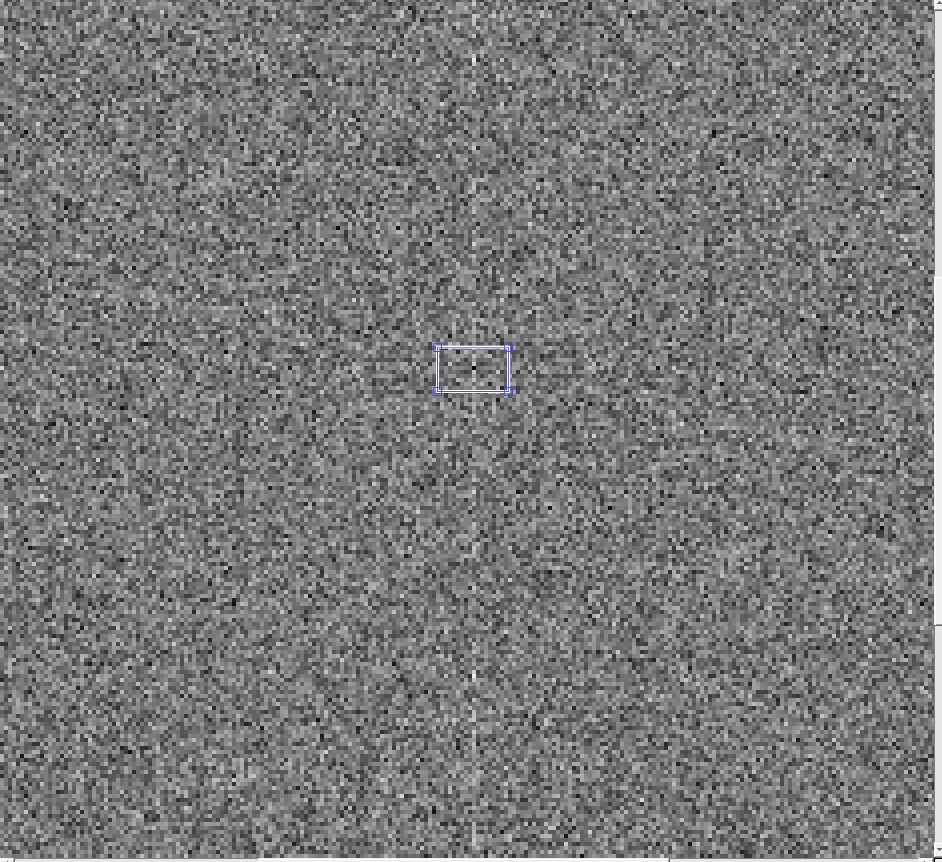
There’s a vertical line. Let’s see what the origin looks like:
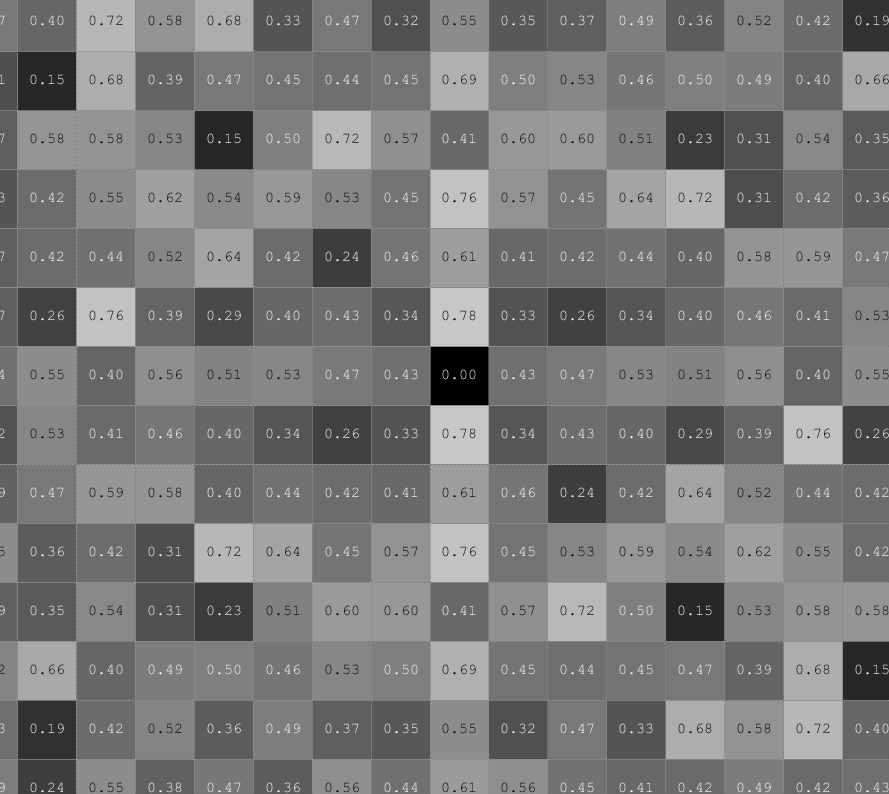
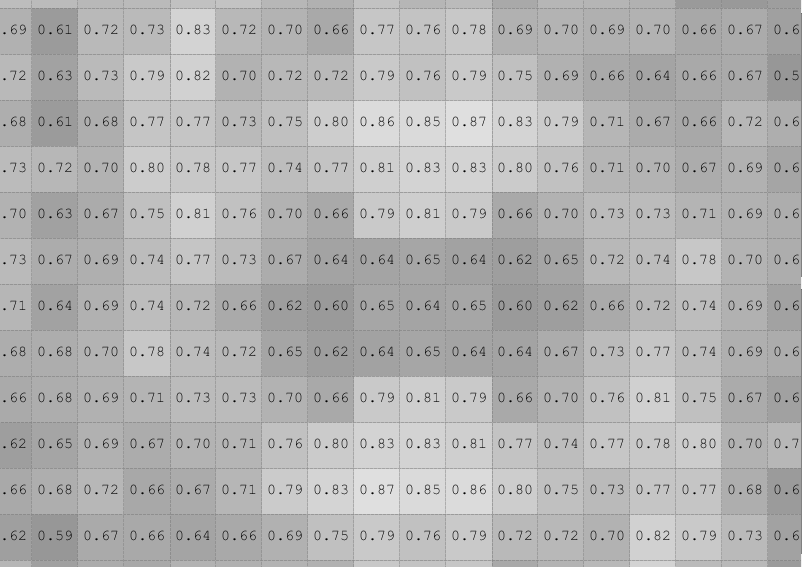
Except for the vertical line, I can’t see much. Let’s see some of the numbers:
Not real illuminating. What if we average the FFT image using a 3×3 kernel, then take a close look at the origin?
If looks like there are peaks in the vertical frequency axis just away from the origin.
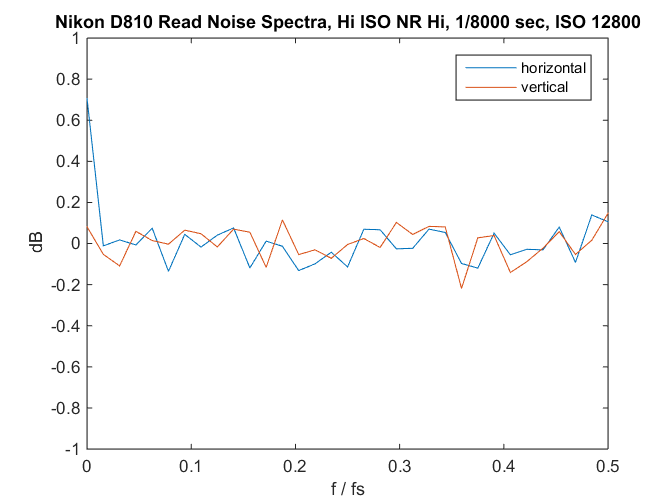
If we look at the frequency distribution of the image spectrum averaged in each direction with 8 pixel wide buckets, we get this:
Except for the dc (zero frequency) component of the horizontal spectrum (that’s our white line), it looks like the dark field is white noise.
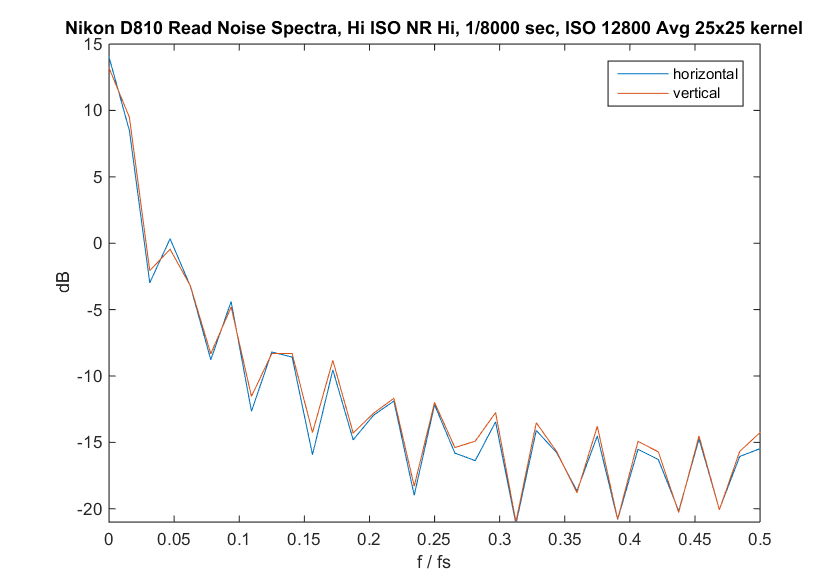
Let’s go back to the image in the space domain, and get rid of most of the high frequency information by passing a 25×25 pixel averaging kernel over it, then applying gain of 1000:
Now we can see some lumpiness and crosshatch features. What happens if we look at the spectrum of that image?
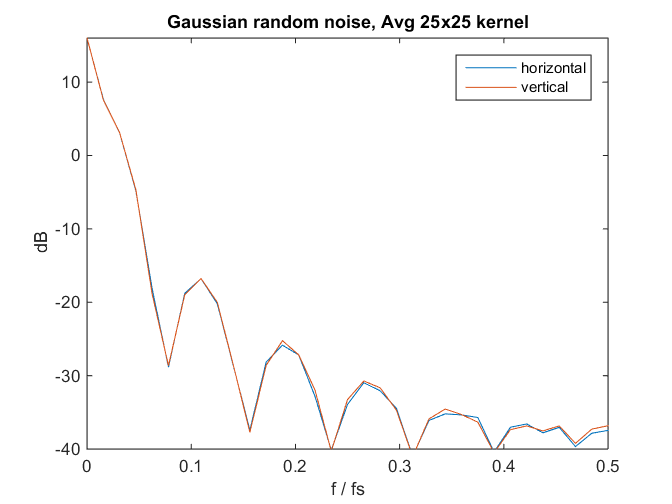
Are we looking at a pattern, or just the lowpass filter response of the 25×25 averaging? Here’s the spectrum of similarly-filtered Gaussian noise:
Hmm… We can’t see much of a pattern in the unfiltered read noise though there are hints. We can see a pattern if we lowpass filter the dark field image. And so far, I don’t have a way to assign a number to the patterning.
Stay tuned.


Ilya Zakharevich says
A) About assigning meaningful numbers to the sensor noise: have you seen
http://www.dpreview.com/forums/post/53992820
? I expect this might interact well with your attempts to understand dynamic range too…
I think I stumbled upon a metric which works better than Fourier transforms — at least for this generation of Sony sensors.
B) You did Fourier transform, and got puzzled. Does it look reasonable to convolve, then redo Fourier transform as an attempt to unpuzzle yourself? 😉
Jim says
Ilya,
Thanks. I haven’t read all the dpr posts in that thread yet (I’ve actually only read yours), but I did read the web page you linked to in the first post. I think you’ve put your finger on what I’m seeing. My initial takeaways from your work — and thank you very much for pointing it out — are that I probably need more samples, and that my frequency analysis was too skewed towards higher frequencies.
The way I see it, I can either try to replicate your results with 1-dimensional averaging kernels of powers-of-two dimensions, or I can analyze the frequency-domain images with binning buckets of powers of two, and look at the dc component. I think both methods should be roughly equivalent.
Comments are appreciated.
Thanks,
Jim