• site home
  • blog home
  • galleries
  • contact
  • underwater
  • the bleeding edge

the last word

Photography meets digital computer technology. Photography wins -- most of the time.

You are here: Home / The Last Word / Leica M240 dark-field images

Leica M240 dark-field images

October 31, 2014 JimK Leave a Comment

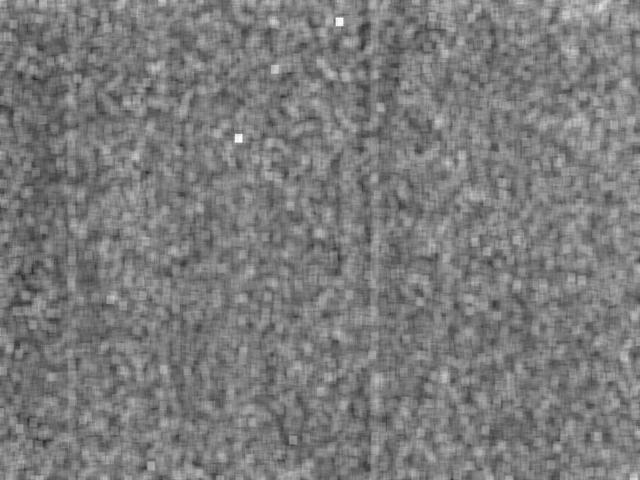
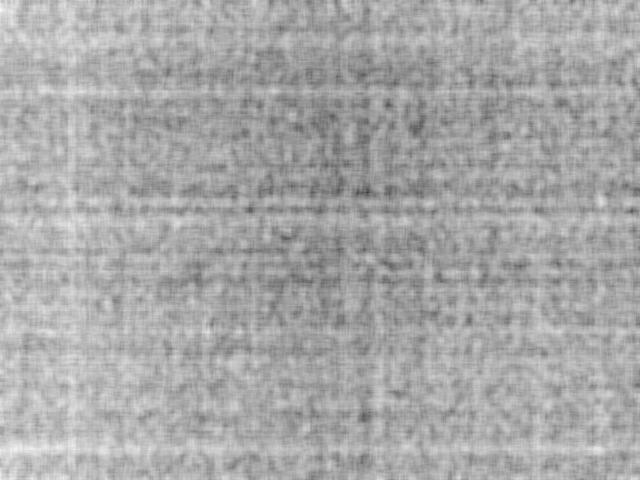
Here’s the ISO 200 unfiltered dark-field image. Like all the images in this post, the images have been scaled into the range [0,1],  have had a gamma curve of 2.2 applied , been res’d down to 640×480, and JPEG’d.

ISO 200
ISO 200

There are hot pixels that darken the average value of the image.

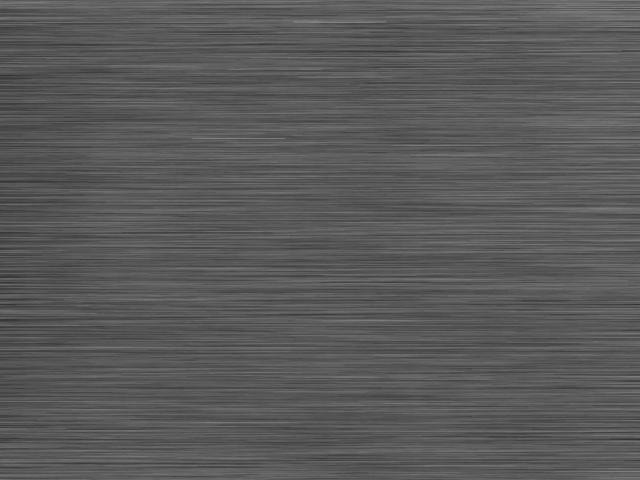
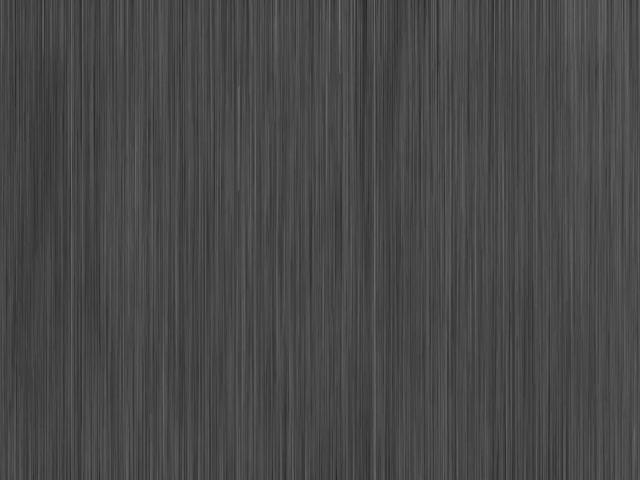
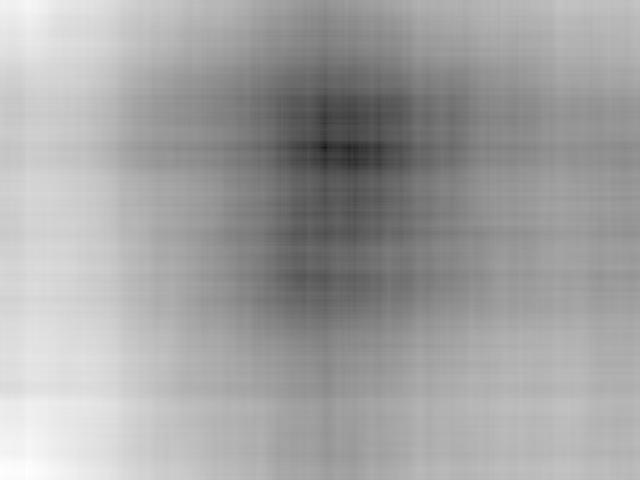
With 36-pixel kernels of three different shapes:

ISO 200 horizontal averaging kernel 36 pixels
ISO 200 vertical averaging kernel 36 pixels
ISO 200 square averaging kernel 36 pixels

The square kernel showcases the locations of the hot pixels. In this image, it looks like most of the low-frequency anomalies are vertically oriented.

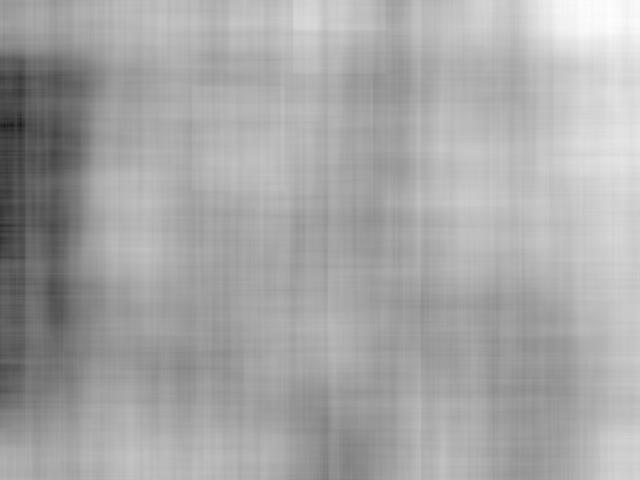
With a set of 434 pixel kernels, this is what we see:

ISO 200 horizontal averaging kernel 434 pixels
ISO 200 vertical averaging kernel 434 pixels
ISO 200 square averaging kernel 434 pixels

Now let’s look at the ISO 1600 image.

First, with no filtering:

ISO 1600
ISO 1600

The hot pixels dominate, though not by quite as much as in the ISO 200 case.

With 36-pixel kernels:

ISO 1600 horizontal averaging kernel 36 pixels
ISO 1600 vertical averaging kernel 36 pixels
ISO 1600 square averaging kernel 36 pixels

You can see why the graphs indicated about the same amount of low-frequency content in both directions.

With a set of 434 pixel kernels:


ISO 1600 horizontal averaging kernel 434 pixels


ISO 1600 vertical averaging kernel 434 pixels
ISO 1600 square averaging kernel 434 pixels


The Last Word

← Leica M240 read noise analysis Nikon D800E read noise analysis →

Leave a Reply Cancel reply

Your email address will not be published. Required fields are marked *

May 2025
S M T W T F S
 123
45678910
11121314151617
18192021222324
25262728293031
« Apr    

Articles

  • About
    • Patents and papers about color
    • Who am I?
  • How to…
    • Backing up photographic images
    • How to change email providers
    • How to shoot slanted edge images for me
  • Lens screening testing
    • Equipment and Software
    • Examples
      • Bad and OK 200-600 at 600
      • Excellent 180-400 zoom
      • Fair 14-30mm zoom
      • Good 100-200 mm MF zoom
      • Good 100-400 zoom
      • Good 100mm lens on P1 P45+
      • Good 120mm MF lens
      • Good 18mm FF lens
      • Good 24-105 mm FF lens
      • Good 24-70 FF zoom
      • Good 35 mm FF lens
      • Good 35-70 MF lens
      • Good 60 mm lens on IQ3-100
      • Good 63 mm MF lens
      • Good 65 mm FF lens
      • Good 85 mm FF lens
      • Good and bad 25mm FF lenses
      • Good zoom at 24 mm
      • Marginal 18mm lens
      • Marginal 35mm FF lens
      • Mildly problematic 55 mm FF lens
      • OK 16-35mm zoom
      • OK 60mm lens on P1 P45+
      • OK Sony 600mm f/4
      • Pretty good 16-35 FF zoom
      • Pretty good 90mm FF lens
      • Problematic 400 mm FF lens
      • Tilted 20 mm f/1.8 FF lens
      • Tilted 30 mm MF lens
      • Tilted 50 mm FF lens
      • Two 15mm FF lenses
    • Found a problem – now what?
    • Goals for this test
    • Minimum target distances
      • MFT
      • APS-C
      • Full frame
      • Small medium format
    • Printable Siemens Star targets
    • Target size on sensor
      • MFT
      • APS-C
      • Full frame
      • Small medium format
    • Test instructions — postproduction
    • Test instructions — reading the images
    • Test instructions – capture
    • Theory of the test
    • What’s wrong with conventional lens screening?
  • Previsualization heresy
  • Privacy Policy
  • Recommended photographic web sites
  • Using in-camera histograms for ETTR
    • Acknowledgments
    • Why ETTR?
    • Normal in-camera histograms
    • Image processing for in-camera histograms
    • Making the in-camera histogram closely represent the raw histogram
    • Shortcuts to UniWB
    • Preparing for monitor-based UniWB
    • A one-step UniWB procedure
    • The math behind the one-step method
    • Iteration using Newton’s Method

Category List

Recent Comments

  • JimK on How Sensor Noise Scales with Exposure Time
  • Štěpán Kaňa on Calculating reach for wildlife photography
  • Štěpán Kaňa on How Sensor Noise Scales with Exposure Time
  • JimK on Calculating reach for wildlife photography
  • Geofrey on Calculating reach for wildlife photography
  • JimK on Calculating reach for wildlife photography
  • Geofrey on Calculating reach for wildlife photography
  • Javier Sanchez on The 16-Bit Fallacy: Why More Isn’t Always Better in Medium Format Cameras
  • Mike MacDonald on Your photograph looks like a painting?
  • Mike MacDonald on Your photograph looks like a painting?

Archives

Copyright © 2025 · Daily Dish Pro On Genesis Framework · WordPress · Log in

Unless otherwise noted, all images copyright Jim Kasson.