• site home
  • blog home
  • galleries
  • contact
  • underwater
  • the bleeding edge

the last word

Photography meets digital computer technology. Photography wins -- most of the time.

You are here: Home / The Last Word / Leica M240 read noise analysis

Leica M240 read noise analysis

October 31, 2014 JimK Leave a Comment

Today I turn the read noise analysis tools developed over the past couple of weeks to a new camera, the Leica M240. The M240 is one of those cameras that subtracts out the black point before it writes the raw file, so we won’t get a clear picture of the read noise from a dark-field exposure. We know from previous experience that the M240 is over-enthusiastic in its subtraction below ISO 1000, resulting in the “green shadows” problem.  As we will see, there’s a method to Leica’s madness; the subtraction reduces low-frequency read noise in the dark-field images, making the camera test better. However, that doesn’t help photographers trying to make real images, since a little light falling on the sensor is enough to reveal the underlying read noise in all its ugliness. So there really is no benefit to the in-camera processing that brings us the green shadows.

Here are curves with one-dimensional averaging with various kernel sizes in both the horizontal and vertical directions:

M240RNH

M240RNV

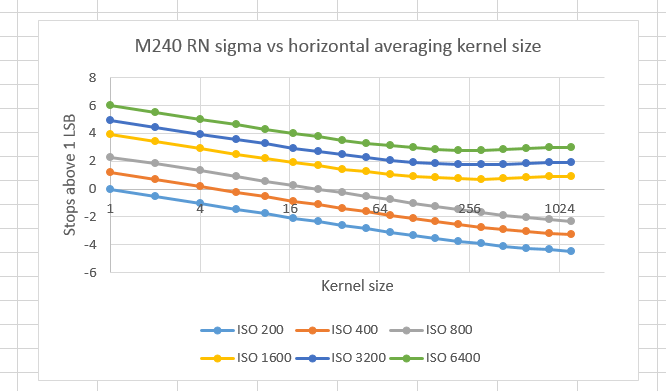
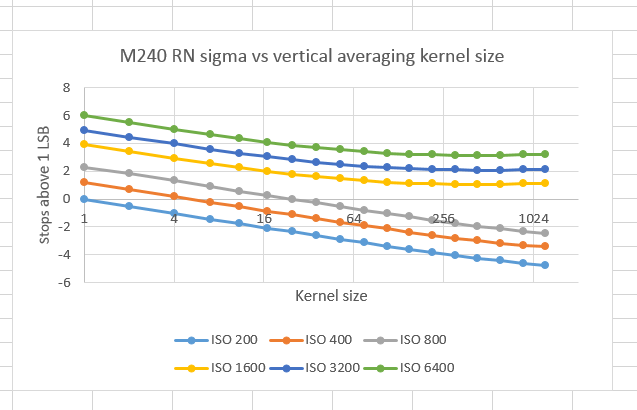
The vertical and horizontal curves are very similar. ISOs 200, 400, and 800 enjoy the benefit of the aggressive black point selection.

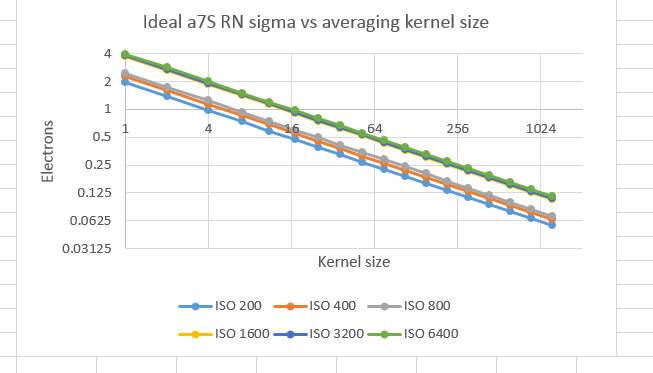
We can look at the curves referenced to the input side of the pre-ADC amplification:

M240sensorH

M240sensorV

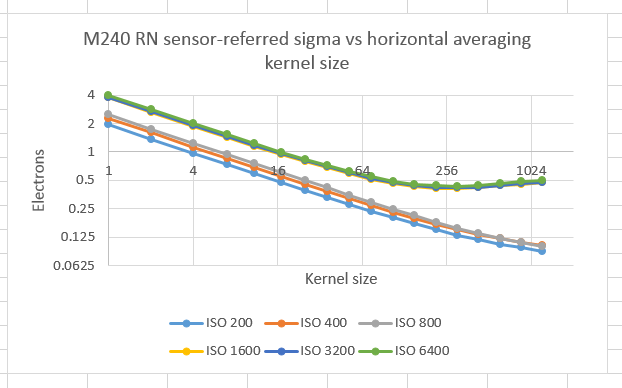
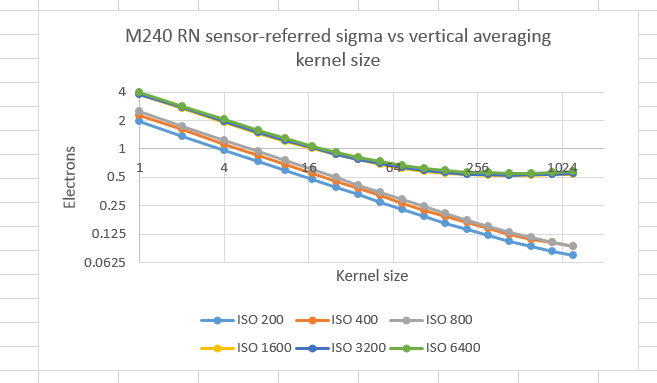
Note that the read noise numbers are much smaller than you’ve seen elsewhere. That’s because, thanks to Leica’s raw processing, we’re not seeing all the real read noise; it’s being cut off on the left side of the histogram. You should double the read noise for ISOs of 1600 and above to get an estimate of the real number, and ISOs below that will need even greater compensation. ISOs 1600, 3200, and 6400 are right on top of each other, indicating that the camera is “ISOless” through this range.

If the M240 read noise were white Gaussian noise, the above two graphs would look like this:

M240RNIdeal

If we normalize the two sensor-referred graphs to the ideal, white-noise case, we get these two plots:

M240RatioH

M240sensorVert

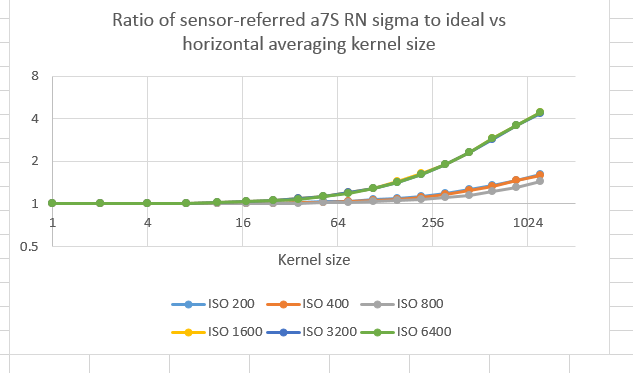
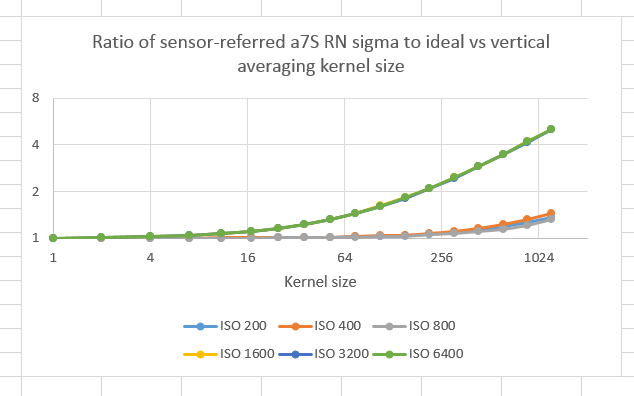
I suggest ignoring the curves for ISOs 200, 400, and 800; they’d probably look like the other ones if Leica didn’t do its black point trick at those ISOs. The other curves are on the good side of what we’re now starting to recognize as typical low-frequency performance. It is commendable that there is littl difference between the horizontal and vertical numbers.

Next up: pictures.


The Last Word

← Hasselblad H2D-39 read noise analysis Leica M240 dark-field images →

Leave a Reply Cancel reply

Your email address will not be published. Required fields are marked *

May 2025
S M T W T F S
 123
45678910
11121314151617
18192021222324
25262728293031
« Apr    

Articles

  • About
    • Patents and papers about color
    • Who am I?
  • How to…
    • Backing up photographic images
    • How to change email providers
    • How to shoot slanted edge images for me
  • Lens screening testing
    • Equipment and Software
    • Examples
      • Bad and OK 200-600 at 600
      • Excellent 180-400 zoom
      • Fair 14-30mm zoom
      • Good 100-200 mm MF zoom
      • Good 100-400 zoom
      • Good 100mm lens on P1 P45+
      • Good 120mm MF lens
      • Good 18mm FF lens
      • Good 24-105 mm FF lens
      • Good 24-70 FF zoom
      • Good 35 mm FF lens
      • Good 35-70 MF lens
      • Good 60 mm lens on IQ3-100
      • Good 63 mm MF lens
      • Good 65 mm FF lens
      • Good 85 mm FF lens
      • Good and bad 25mm FF lenses
      • Good zoom at 24 mm
      • Marginal 18mm lens
      • Marginal 35mm FF lens
      • Mildly problematic 55 mm FF lens
      • OK 16-35mm zoom
      • OK 60mm lens on P1 P45+
      • OK Sony 600mm f/4
      • Pretty good 16-35 FF zoom
      • Pretty good 90mm FF lens
      • Problematic 400 mm FF lens
      • Tilted 20 mm f/1.8 FF lens
      • Tilted 30 mm MF lens
      • Tilted 50 mm FF lens
      • Two 15mm FF lenses
    • Found a problem – now what?
    • Goals for this test
    • Minimum target distances
      • MFT
      • APS-C
      • Full frame
      • Small medium format
    • Printable Siemens Star targets
    • Target size on sensor
      • MFT
      • APS-C
      • Full frame
      • Small medium format
    • Test instructions — postproduction
    • Test instructions — reading the images
    • Test instructions – capture
    • Theory of the test
    • What’s wrong with conventional lens screening?
  • Previsualization heresy
  • Privacy Policy
  • Recommended photographic web sites
  • Using in-camera histograms for ETTR
    • Acknowledgments
    • Why ETTR?
    • Normal in-camera histograms
    • Image processing for in-camera histograms
    • Making the in-camera histogram closely represent the raw histogram
    • Shortcuts to UniWB
    • Preparing for monitor-based UniWB
    • A one-step UniWB procedure
    • The math behind the one-step method
    • Iteration using Newton’s Method

Category List

Recent Comments

  • John Griffin on The 16-Bit Fallacy: Why More Isn’t Always Better in Medium Format Cameras
  • JimK on How Sensor Noise Scales with Exposure Time
  • Štěpán Kaňa on Calculating reach for wildlife photography
  • Štěpán Kaňa on How Sensor Noise Scales with Exposure Time
  • JimK on Calculating reach for wildlife photography
  • Geofrey on Calculating reach for wildlife photography
  • JimK on Calculating reach for wildlife photography
  • Geofrey on Calculating reach for wildlife photography
  • Javier Sanchez on The 16-Bit Fallacy: Why More Isn’t Always Better in Medium Format Cameras
  • Mike MacDonald on Your photograph looks like a painting?

Archives

Copyright © 2025 · Daily Dish Pro On Genesis Framework · WordPress · Log in

Unless otherwise noted, all images copyright Jim Kasson.