Fair warning: this is a nerdy little post, of interest only to photo-techies and numbers junkies.
Who’s left? Jack, I knew I could count on you.
A reader took me to task several days ago for using the Adobe RGB green channel as a proxy for luminance when I measured focus accuracy and focus shift. In the past, Jack Hogan and I have dealt with a similar issue when analyzing focus using MTF curves and the three raw channels. It turned out to be pretty easy to add luminance as a focusing metric to my present focus plane tester, so I did.
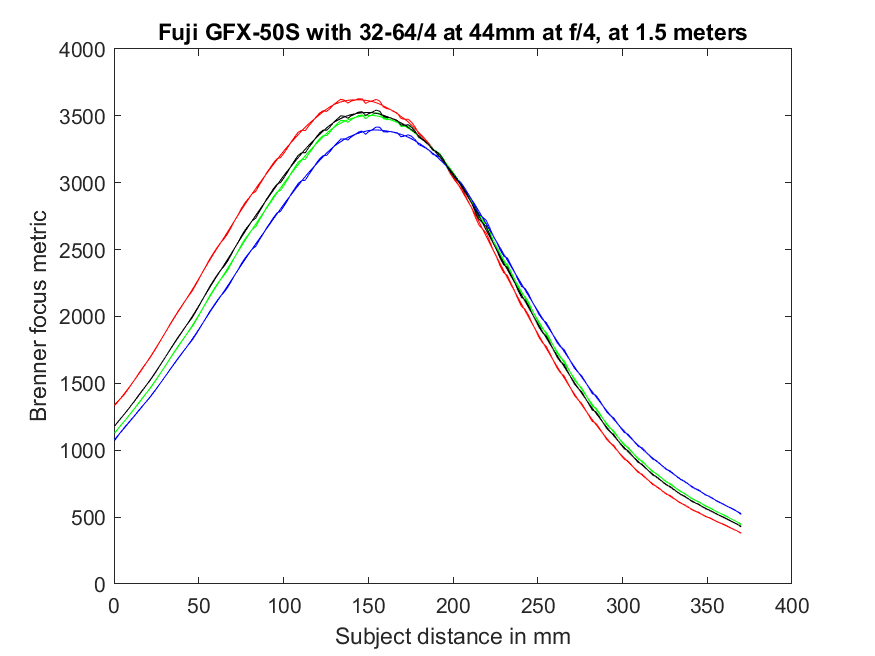
Here’s a sample:
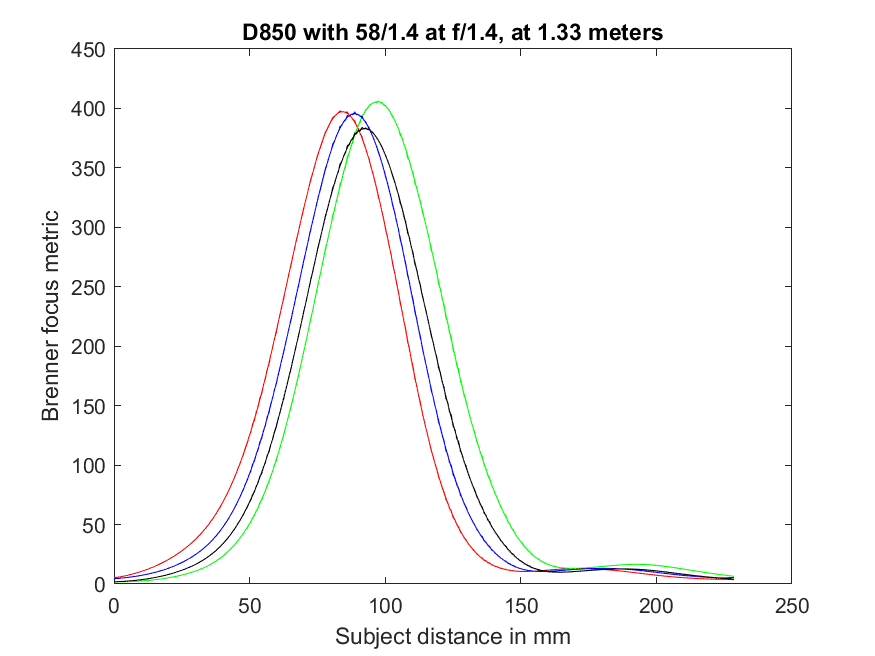
There are eight curves plotted in the above graph. The red, green, and blue Adobe RGB channels are plotted in — as you might guess — red, green, and blue. Luminance is plotted in black. For each of those, the raw output of the focus quality algorithm and the smoothed version that I use to establish focus plane are plotted. In this case, the green channel is a pretty good proxy for luminance.
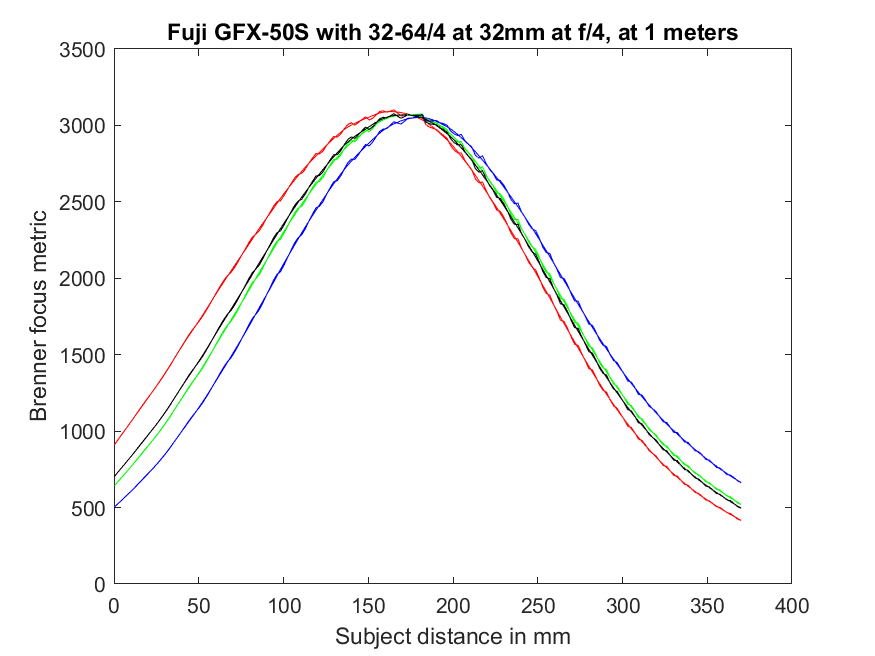
Here’s another plot where that’s true:
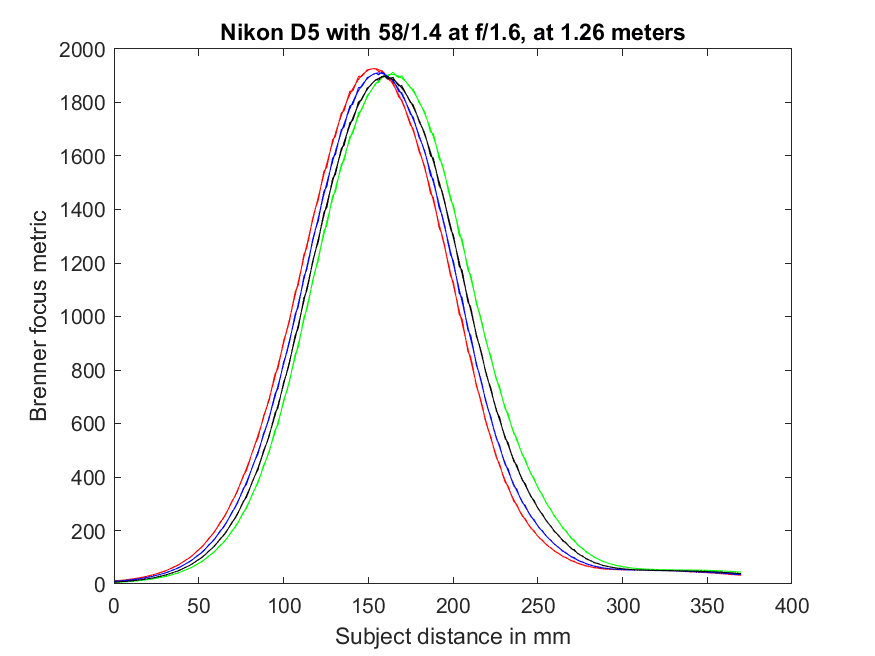
But that’s not always the case:
Now, because of the pull of the red and blue channels in the same direction, the luminance plot ends up looking quite a bit different from the green channel lines.
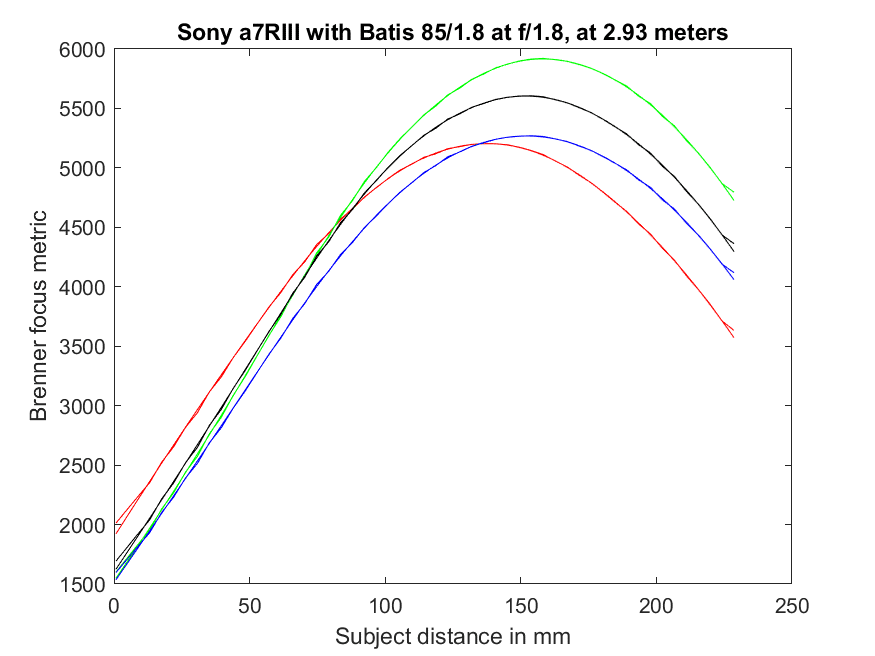
Same with this Batis and the short ramp:
In some cases, the luminance peak can be lower than any of the color planes:
I’ve not found any way to accurately approximate the luminance curves from the RGB ones. To get the luminance curves, you need to convert the RGB image to luminance, and then run the focus quality algorithm on that image.
jaapv says
What about using the luminance channel in LAB?
JimK says
I’m using Y, so the difference is only the nonlinearity.
JaapD says
Hi jim,
How did you calculate Luminance? Something like 0,33R + 0,33G + 0,33B or 0.30R + 59G + 0,11B?
Regards,
Jaap.
JimK says
The image was in Adobe RGB. First I linearized the triplets, then I calculated Y as follows: 0.29734 * R + 0.62736 * G + 0.07529 * B.
Here’s a reference: https://www.adobe.com/digitalimag/pdfs/AdobeRGB1998.pdf