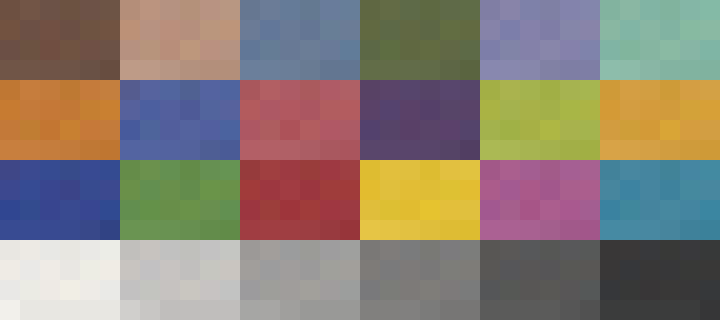
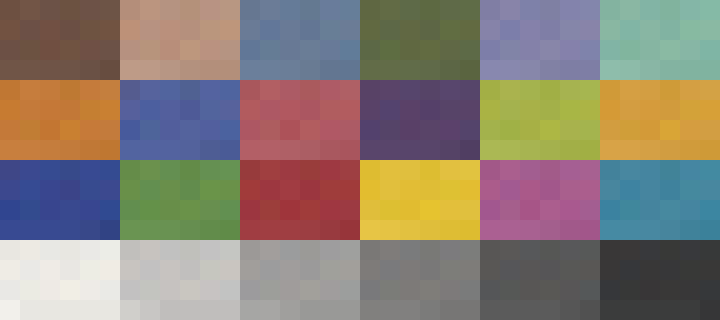
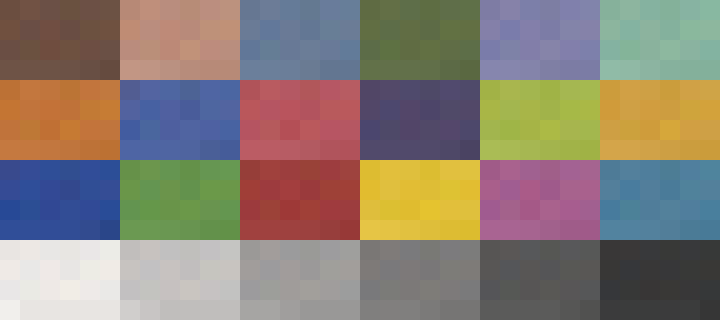
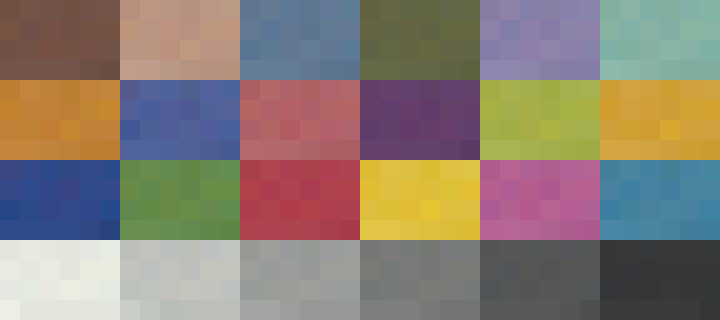
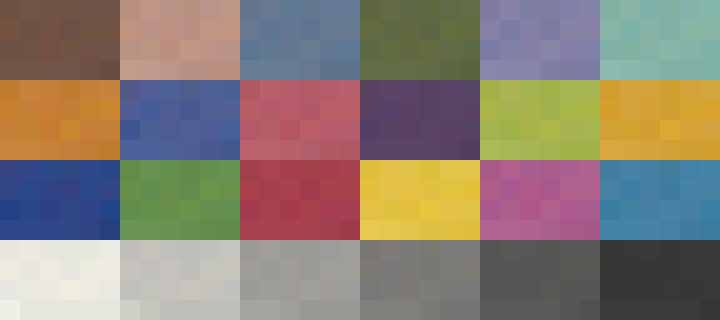
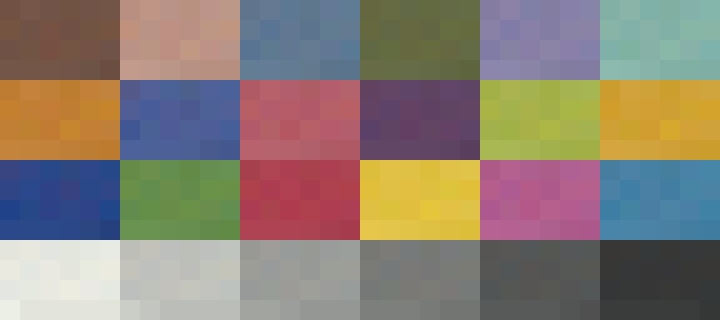
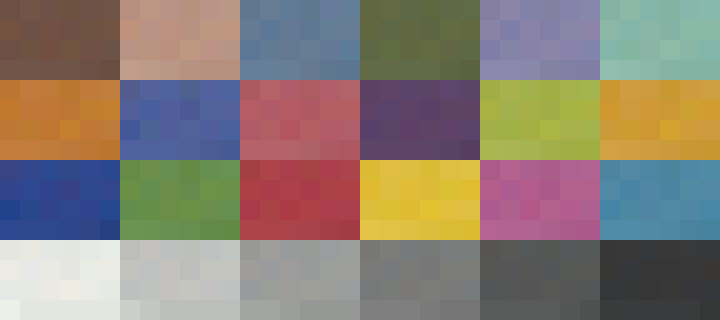
In the previous post, I looked a what I’m calling microcolor effects with various simulated cameras. I know that some of you prefer visuals to graphs. This post is for you. I’ll post all the images from which the graphs in the previous post were derived.
What’s shown here are 24 base patches, each one of which is composed of 24 spectra derived from them by mixing with the other 23 to achieve a CIELab DeltaE 2000 of 2. The original patch spectra are included in the same position in base patch set as they are in the original Macbeth CC24 chart. These are all in the Adobe RGB color space, since sRGB can’t represent the entire Macbeth CC24 chart.



Leave a Reply