• site home
  • blog home
  • galleries
  • contact
  • underwater
  • the bleeding edge

the last word

Photography meets digital computer technology. Photography wins -- most of the time.

You are here: Home / The Last Word / Modeling ISO-induced variations in read noise

Modeling ISO-induced variations in read noise

December 13, 2014 JimK Leave a Comment

In yesterday’s post, I showed results of the photon transfer analysis programs modeling the Nikon D4’s full well capacity and read noise for each ISO setting of interest. Today, I’d like to show you what happens when you attempt something more challenging: modeling the behavior of the ISO adjustment knob as well.

To do this, we separate the read noise into two components, as described earlier. The first is the read noise on the sensor side of the amplifier whose gain is controlled by the ISO knob. I call that the pre-amp read noise, and its units are electrons.  The second is the read noise on the ADC side of the amplifier. I call that the post-amp read noise, and its units are ADC LSBs.  Let me explain that last unit a bit. Yes, the post-amp read noise is an analog quantity, and we could measure it in volts — actually microvolts — but that wouldn’t mean much to us as photographers. We care about how it makes the digitized result uncertain, and thus it is natural to measure it in the units that we see when we look at the raw files.

Once we’ve performed this mental and programmatic separation, we then tell the program to minimize the sum of the squared error between the measured and modeled cameras by adjusting the full well capacity, the pre-amp read noise, and the post-amp read noise.

If we turn the program loose on the D4 data, we get this:

D4Allresults

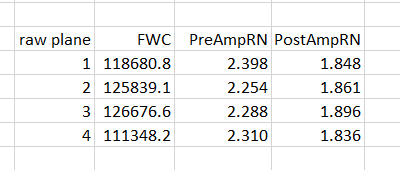
The raw plane, or raw channel, order for the D4 is RGGB, so you can see that the program says that the red and blue channels have lower FWC than the two green channels, just as in yesterday’s results. I still am unclear about the reason for this, but I suspect that if has something to do with white balance prescaling.

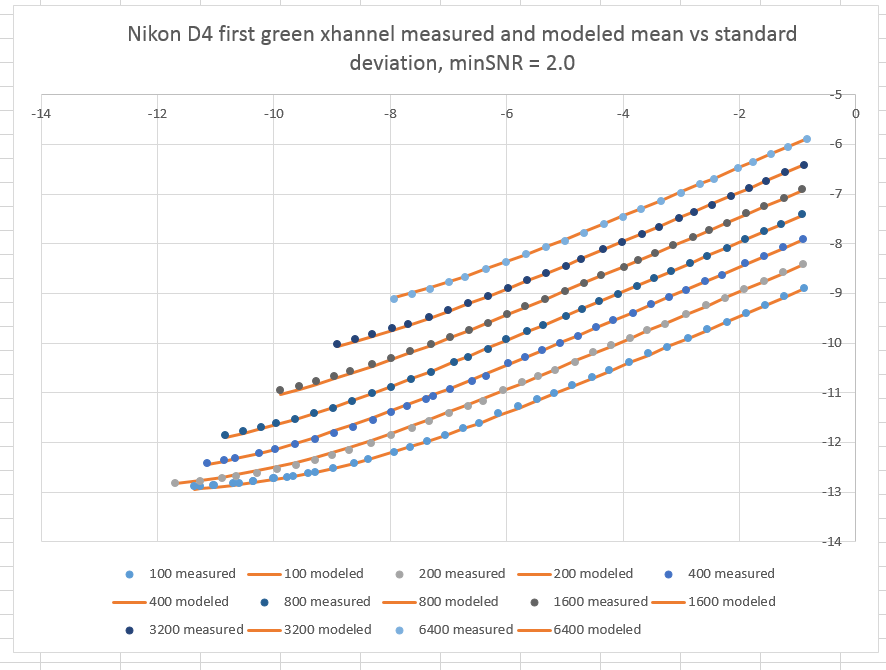
Let’s look at the first green channel and see how well the modeled data matches the measured data. First we’ll look at standard deviation:

D5measvsmodAllGchannel

Then at SNR:

D4measvsmodAllGchannelSNR

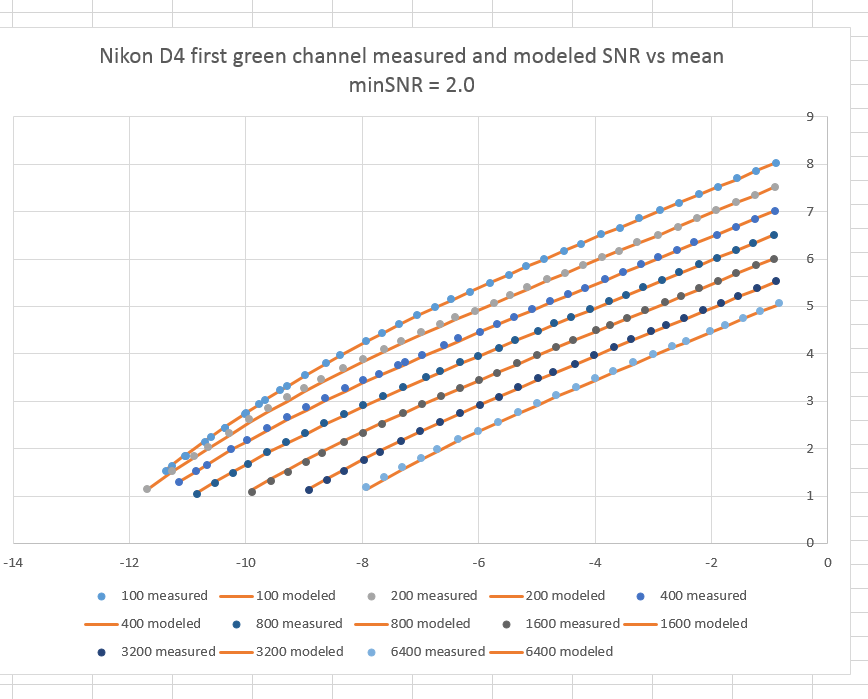
The match is quite good, indicating that the D4 doesn’t have much in the way of ISO-dependent  tricks up its sleeve.

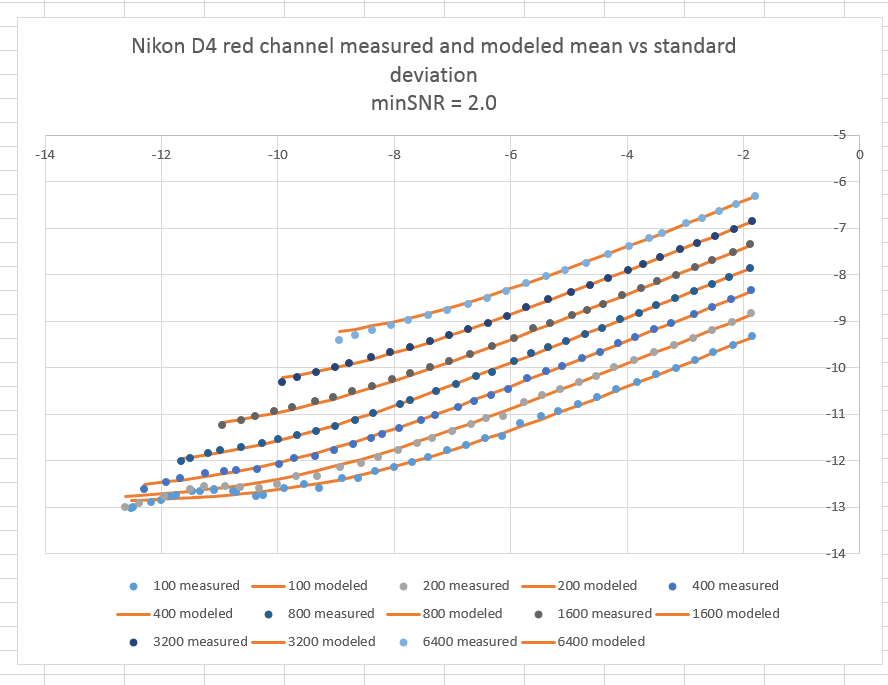
Now the standard deviations in the red channel:

D4measvsmodAllRchannel

and the SNRs in that channel:

D4measvsmodAllRchannelSNR

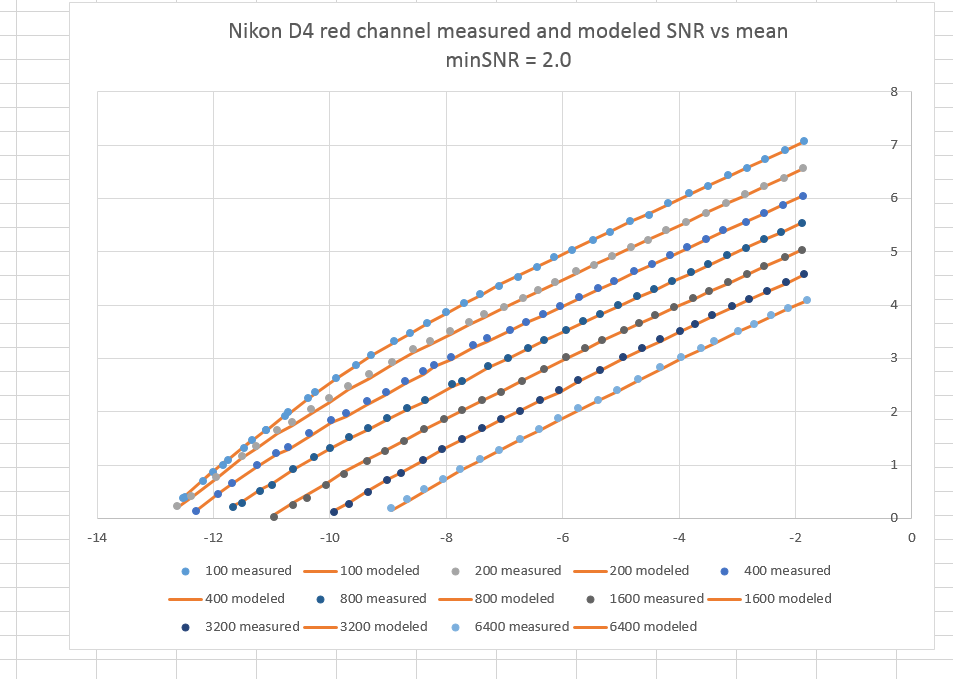
Note that the red channel is missing the upper stop or so of data. That’s because I used a D55 light source, and the red an blue channels are substantially down from the green ones with that input spectrum.

The Last Word

← Automatic measurement of photon and read noise Camera modeling details →

Leave a Reply Cancel reply

Your email address will not be published. Required fields are marked *

May 2025
S M T W T F S
 123
45678910
11121314151617
18192021222324
25262728293031
« Apr    

Articles

  • About
    • Patents and papers about color
    • Who am I?
  • How to…
    • Backing up photographic images
    • How to change email providers
    • How to shoot slanted edge images for me
  • Lens screening testing
    • Equipment and Software
    • Examples
      • Bad and OK 200-600 at 600
      • Excellent 180-400 zoom
      • Fair 14-30mm zoom
      • Good 100-200 mm MF zoom
      • Good 100-400 zoom
      • Good 100mm lens on P1 P45+
      • Good 120mm MF lens
      • Good 18mm FF lens
      • Good 24-105 mm FF lens
      • Good 24-70 FF zoom
      • Good 35 mm FF lens
      • Good 35-70 MF lens
      • Good 60 mm lens on IQ3-100
      • Good 63 mm MF lens
      • Good 65 mm FF lens
      • Good 85 mm FF lens
      • Good and bad 25mm FF lenses
      • Good zoom at 24 mm
      • Marginal 18mm lens
      • Marginal 35mm FF lens
      • Mildly problematic 55 mm FF lens
      • OK 16-35mm zoom
      • OK 60mm lens on P1 P45+
      • OK Sony 600mm f/4
      • Pretty good 16-35 FF zoom
      • Pretty good 90mm FF lens
      • Problematic 400 mm FF lens
      • Tilted 20 mm f/1.8 FF lens
      • Tilted 30 mm MF lens
      • Tilted 50 mm FF lens
      • Two 15mm FF lenses
    • Found a problem – now what?
    • Goals for this test
    • Minimum target distances
      • MFT
      • APS-C
      • Full frame
      • Small medium format
    • Printable Siemens Star targets
    • Target size on sensor
      • MFT
      • APS-C
      • Full frame
      • Small medium format
    • Test instructions — postproduction
    • Test instructions — reading the images
    • Test instructions – capture
    • Theory of the test
    • What’s wrong with conventional lens screening?
  • Previsualization heresy
  • Privacy Policy
  • Recommended photographic web sites
  • Using in-camera histograms for ETTR
    • Acknowledgments
    • Why ETTR?
    • Normal in-camera histograms
    • Image processing for in-camera histograms
    • Making the in-camera histogram closely represent the raw histogram
    • Shortcuts to UniWB
    • Preparing for monitor-based UniWB
    • A one-step UniWB procedure
    • The math behind the one-step method
    • Iteration using Newton’s Method

Category List

Recent Comments

  • JimK on How Sensor Noise Scales with Exposure Time
  • Štěpán Kaňa on Calculating reach for wildlife photography
  • Štěpán Kaňa on How Sensor Noise Scales with Exposure Time
  • JimK on Calculating reach for wildlife photography
  • Geofrey on Calculating reach for wildlife photography
  • JimK on Calculating reach for wildlife photography
  • Geofrey on Calculating reach for wildlife photography
  • Javier Sanchez on The 16-Bit Fallacy: Why More Isn’t Always Better in Medium Format Cameras
  • Mike MacDonald on Your photograph looks like a painting?
  • Mike MacDonald on Your photograph looks like a painting?

Archives

Copyright © 2025 · Daily Dish Pro On Genesis Framework · WordPress · Log in

Unless otherwise noted, all images copyright Jim Kasson.