• site home
  • blog home
  • galleries
  • contact
  • underwater
  • the bleeding edge

the last word

Photography meets digital computer technology. Photography wins -- most of the time.

You are here: Home / The Last Word / Modeling the a7II one ISO at a time

Modeling the a7II one ISO at a time

December 21, 2014 JimK Leave a Comment

In the post before last, I modeled the Sony a7II over a range of in-camera ISO settings, and reported on the results. Today, I’ll show you what happens when you model the camera one ISO at a time. This is a much simpler task, aside from the fact that you have to do it over and over. It also tends to produce closer matches between the modeled and measured values.

But what it’s really good at is finding places where the camera does something not predicted in the standard model when you twist that ISO knob.

Let’s take a look at some results, first for read noise:

a7iiRNvsISO

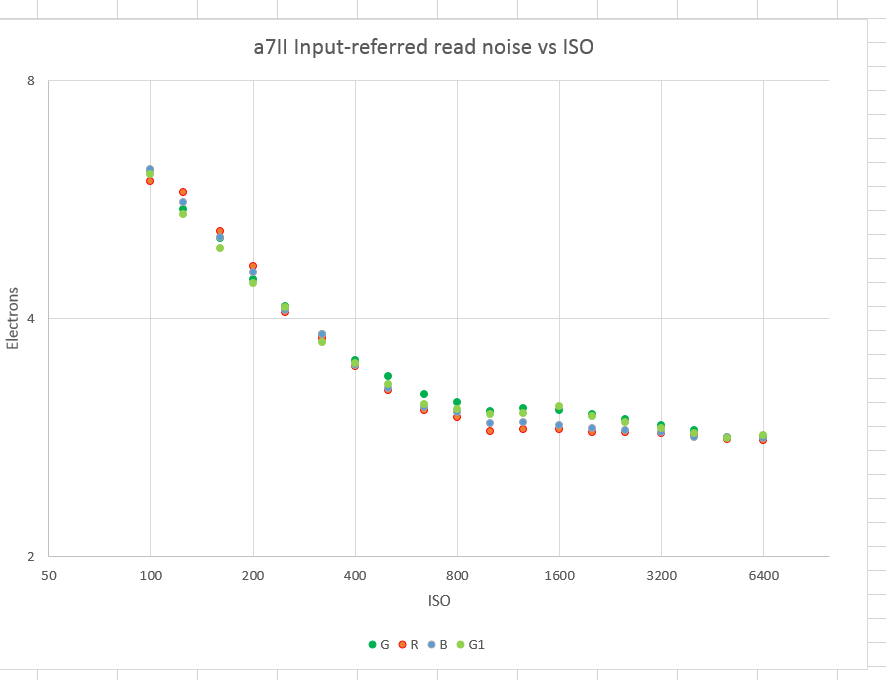
The read noise is reported in electrons before the amplifier, assuming that all the read noise is there (the post-amp read noise is zero).

One of the things this curve tells us is that there is really very little reason to turn the ISO knob on the a7II much past 1000. The read noise doesn’t drop appreciably after that, so you’re better off pushing in post. I’ll be posting the results of another test that deals with this subject later.

Now let’s see how the modeled full-well capacity (FWC) changes with ISO setting:

a7iiFWCvsISO

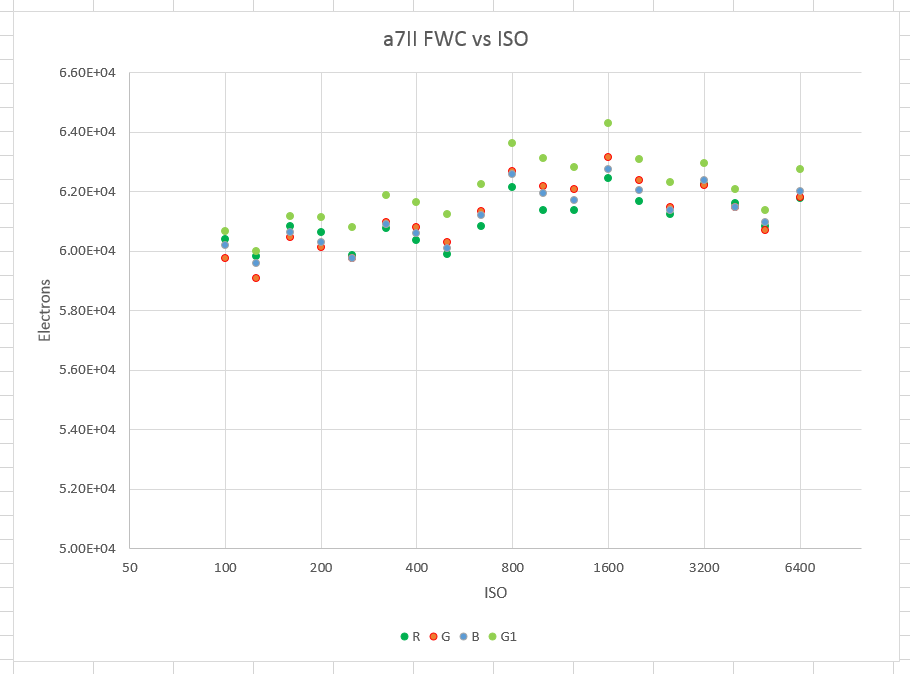
The short answer is that it doesn’t. However, there seems to be a very slight systematic upward slope until about ISO 1600. I don’t know what that’s about, and the effect is too small for me to care.

There’s another way to look at read noise, and that’s as the noise floor that limits dynamic range. This is called “Engineering Dynamic Range.” I happen to look at that name as a mild insult to engineers, but the term is ubiquitous, so I’ll use it. I prefer something I call “Photographic Dynamic Range”, which puts the bottom usable signal at about a SNR of 10.

But enough of that. Here’s the engineering dynamic range of the a7II as a function of ISO setting:

a7iiDRvsISO

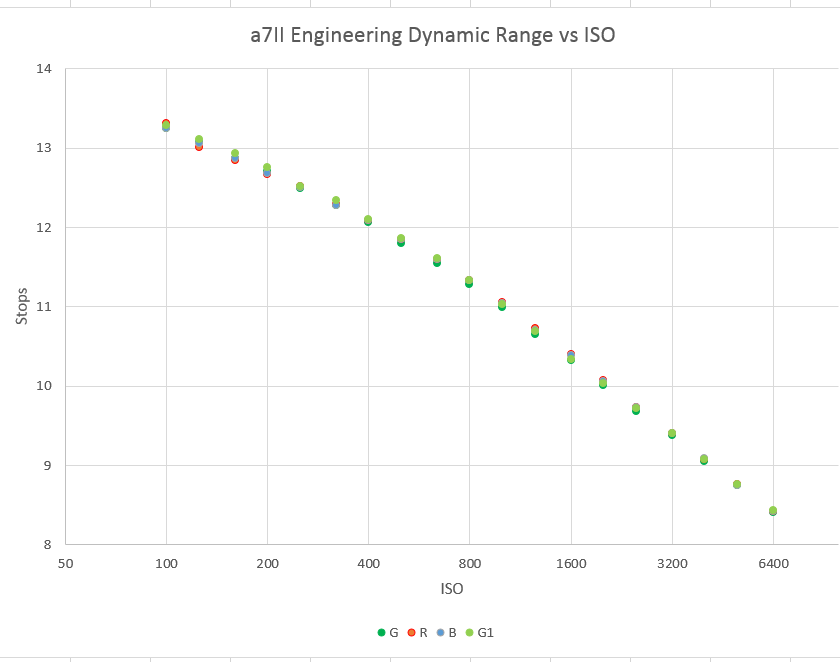
There are no jumps or lumps in the curve that would indicate some unusual chip design or raw processing wizardry.  There is a slight rounding of the curve at low ISOs. This is not unusual.

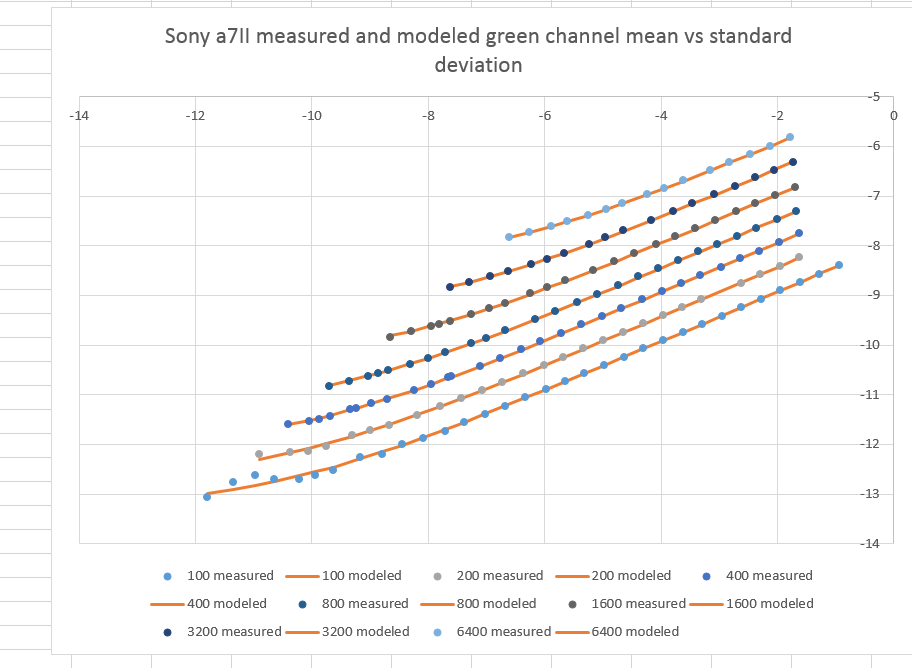
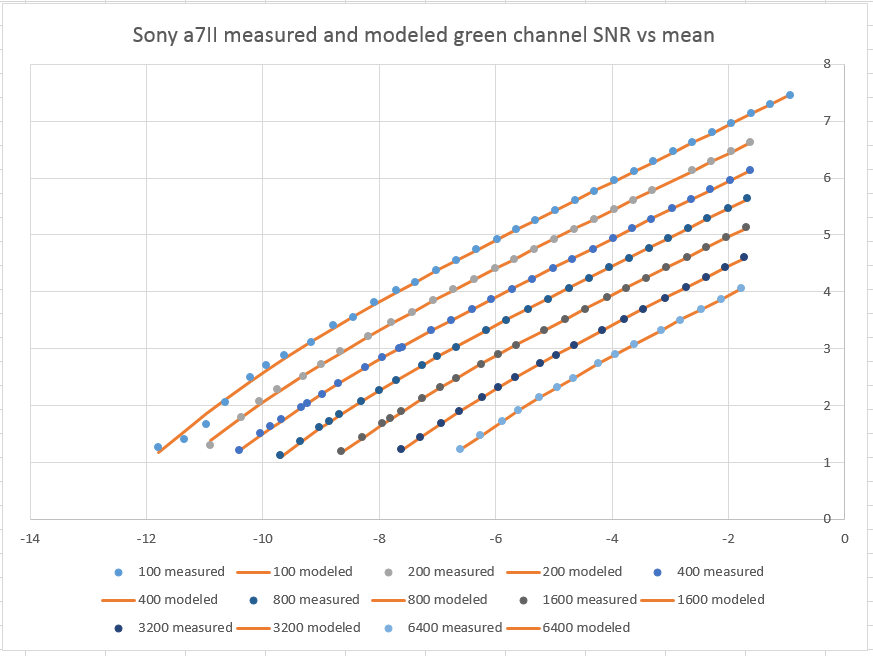
How well does the modeled data fit the measured data? Pretty darned well:

a7iimeasmodelsingleisoSigma


a7iimeasmodelsingleisoSNR

The Last Word

← Comparing the a7II photon-transfer model to other cameras Comparing two a7II models →

Leave a Reply Cancel reply

Your email address will not be published. Required fields are marked *

May 2025
S M T W T F S
 123
45678910
11121314151617
18192021222324
25262728293031
« Apr    

Articles

  • About
    • Patents and papers about color
    • Who am I?
  • How to…
    • Backing up photographic images
    • How to change email providers
    • How to shoot slanted edge images for me
  • Lens screening testing
    • Equipment and Software
    • Examples
      • Bad and OK 200-600 at 600
      • Excellent 180-400 zoom
      • Fair 14-30mm zoom
      • Good 100-200 mm MF zoom
      • Good 100-400 zoom
      • Good 100mm lens on P1 P45+
      • Good 120mm MF lens
      • Good 18mm FF lens
      • Good 24-105 mm FF lens
      • Good 24-70 FF zoom
      • Good 35 mm FF lens
      • Good 35-70 MF lens
      • Good 60 mm lens on IQ3-100
      • Good 63 mm MF lens
      • Good 65 mm FF lens
      • Good 85 mm FF lens
      • Good and bad 25mm FF lenses
      • Good zoom at 24 mm
      • Marginal 18mm lens
      • Marginal 35mm FF lens
      • Mildly problematic 55 mm FF lens
      • OK 16-35mm zoom
      • OK 60mm lens on P1 P45+
      • OK Sony 600mm f/4
      • Pretty good 16-35 FF zoom
      • Pretty good 90mm FF lens
      • Problematic 400 mm FF lens
      • Tilted 20 mm f/1.8 FF lens
      • Tilted 30 mm MF lens
      • Tilted 50 mm FF lens
      • Two 15mm FF lenses
    • Found a problem – now what?
    • Goals for this test
    • Minimum target distances
      • MFT
      • APS-C
      • Full frame
      • Small medium format
    • Printable Siemens Star targets
    • Target size on sensor
      • MFT
      • APS-C
      • Full frame
      • Small medium format
    • Test instructions — postproduction
    • Test instructions — reading the images
    • Test instructions – capture
    • Theory of the test
    • What’s wrong with conventional lens screening?
  • Previsualization heresy
  • Privacy Policy
  • Recommended photographic web sites
  • Using in-camera histograms for ETTR
    • Acknowledgments
    • Why ETTR?
    • Normal in-camera histograms
    • Image processing for in-camera histograms
    • Making the in-camera histogram closely represent the raw histogram
    • Shortcuts to UniWB
    • Preparing for monitor-based UniWB
    • A one-step UniWB procedure
    • The math behind the one-step method
    • Iteration using Newton’s Method

Category List

Recent Comments

  • bob lozano on The 16-Bit Fallacy: Why More Isn’t Always Better in Medium Format Cameras
  • JimK on Goldilocks and the three flashes
  • DC Wedding Photographer on Goldilocks and the three flashes
  • Wedding Photographer in DC on The 16-Bit Fallacy: Why More Isn’t Always Better in Medium Format Cameras
  • JimK on Fujifilm GFX 100S II precision
  • Renjie Zhu on Fujifilm GFX 100S II precision
  • JimK on Fuji 20-35/4 landscape field curvature at 23mm vs 23/4 GF
  • Ivo de Man on Fuji 20-35/4 landscape field curvature at 23mm vs 23/4 GF
  • JimK on Fuji 20-35/4 landscape field curvature at 23mm vs 23/4 GF
  • JimK on Fuji 20-35/4 landscape field curvature at 23mm vs 23/4 GF

Archives

Copyright © 2025 · Daily Dish Pro On Genesis Framework · WordPress · Log in

Unless otherwise noted, all images copyright Jim Kasson.