I’ve been analyzing the low-frequency behavior of read noise in several cameras for the last two weeks. Now I turn my attention to how much of the dark-field images vary from exposure to exposure, and how much form a fixed pattern. In addition, I will explore the differences in the spatial spectra of the fixed and variable parts of the dark-field image.
The camera I’ve chosen for my first set of experiments is the Nikon D810, I started by making a series of dark-field exposures at ISO 1000 and 1/8000 second. I chose ISO 1000 because that is the ISO where the D810 just starts to clip the left side of the dark-field histogram. It is also the highest ISO on the camera that has no digital gain applied.
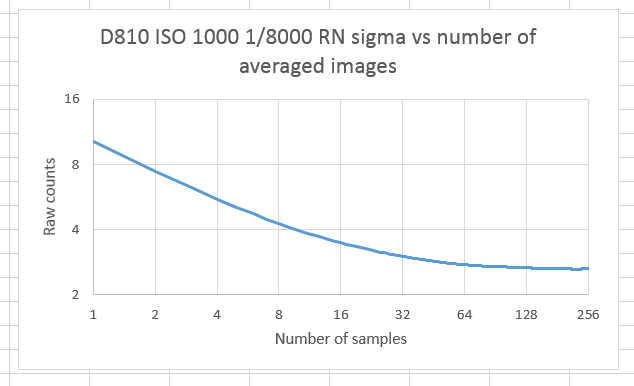
I made 256 exposures, and averaged the raw images (all four channels), recording the standard deviation of the averaged image after each exposure was averaged in:
You can see that the curve flattens out after about 128 images in the average, which means that there’s a portion of the dark-field image that doesn’t vary from frame to frame.
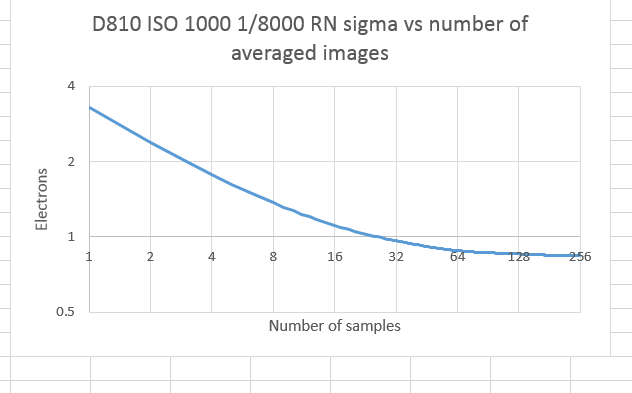
Want to see it in electrons? Sure thing:
The electron count of the curve’s intercept with the left axis may be bigger than you’re used to seeing. That’s because I took the standard deviation of the entire frame, not of a small crop.
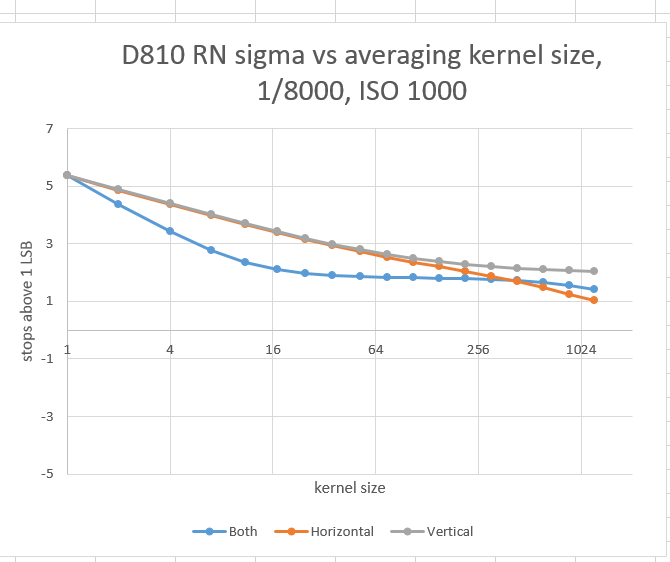
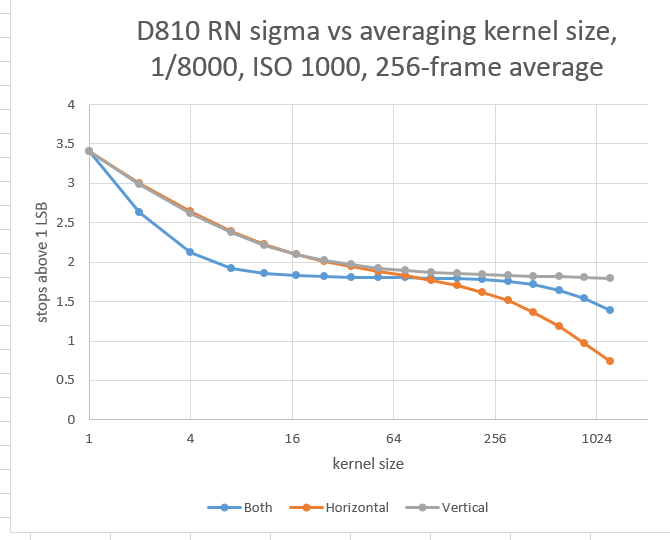
Then I took one of the dark-field images and measured the way that the standard deviation varied with averaging kernels of three shapes (one dimensional horizontal, one dimensional vertical, and square) and many sizes:
You can see that the curves flatten out, indicating that there the spatial frequency content of the dark-field image is not flat, or white, but that there is more low frequency content than would be in an image with a flat frequency spectrum.
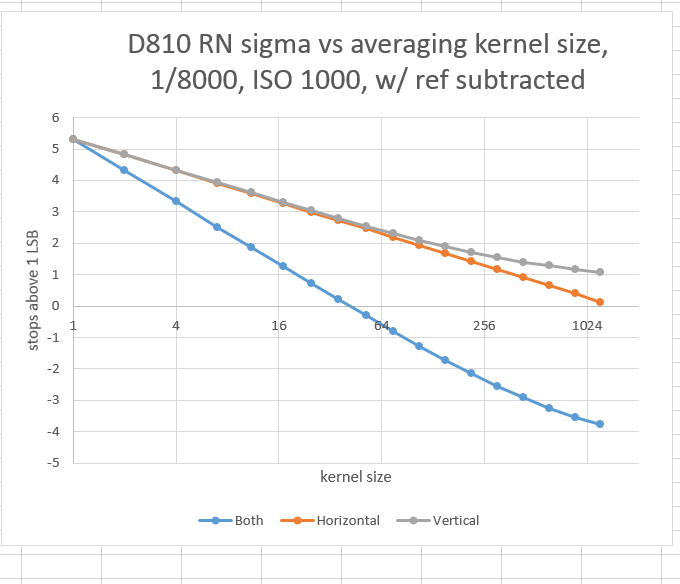
I performed the same set of calculations after subtracting the average of 256 frames from the dark-field image:
Now there is very little flattening of the curves — although there is some with the largest vertical kernels — indicating that the corrected image has very little additional low-frequency content over that of an image whose noise is white.
We can get another angle on it by processing the averaged image:
Yes, indeed. That’s where the low frequency content is. Middle frequency, too, look how the curves start to flatten for even very small kernels.
It looks like almost all the low-frequency “read noise” of the D810 can be eliminated with the subtraction of a reference image. You deep-sky photographers might want to take note of that.
Leave a Reply