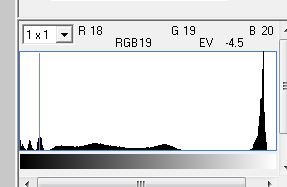
For the past nine months, I’ve been using the Betterlight scanning back. The software that runs the back has a capability that, as far as I know, is unique among all the current crop of digital cameras: it will display the histogram of the captured image in its native color space. In fact, that is the only way you can get the histogram.
I consider the Betterlight histogram to be an exemplar of its function. You can click on one or more points in the image, and it will show their position on the histogram and give you a numeric reading of their luminance in EV.
In addition, it displays the horizontal axis logarithmically, and there’s a mode where it will identify the top two one f-stop bands, the bottom two such bands, and the middle grey band by color:
It will also show you where those regions are in the image:
Some of you are right with me and are saying how great that is, especially the true raw histogram part. For everybody else, let me back up a little bit.
Unless you’re a Betterlight user, the histograms that you’re used to seeing on the back of your camera are not presented in terms of the primaries of the camera’s native color space. The way that most digital photography experts put it is that the histogram you see on the back of the camera is computed from a JPEG image.
If you’re using a camera that computes the histogram before the exposure is made, like a mirrorless interchangeable lens camera, I don’t believe that the above explanation is strictly accurate, although it’s on the right track. What I think is happening – and the camera manufacturers are not particularly forthcoming, so I don’t know for sure – is that the histogram that you see is derived from part of the image processing chain that produces the JPEG file. I think that the image processing ahead of the histogram computation shares many operations — demosaicing, conversion to a standard color space (in most high-end cameras, the choices are sRGB or Adobe 1998 RGB), white balance, contrast settings, and special effects — with the JPEG processing. To produce the histogram, the camera subsamples (to make the computation easier), and assigns pixels to buckets. To produce the JPEG file, the camera performs the 8×8 discrete cosine transform JPEG compression and formats the data in the standard JPEG file format.
If you’re using a DSLR and using live view, the above applies. If you aren’t using live view, you make the exposure and then you look at the histogram. In that case, even if you have your camera configured to save the image in raw format, it’s likely that you are looking at a histogram created from the data in the raw file, either from a JPEG preview image, or computed from the raw data using the settings for color space, contrast settings, and special effects encoded in the metadata. If anyone knows the details of how this is done in any particular camera, I’d be delighted to learn more.
If you’re trying to use the histogram in the back of the camera to get the correct exposure using the expose-to-the-right (ETTR) method, having the camera present the histogram of the image after extensive processing is not at all what you want. Almost all the time, the camera’s histogram will show clipping at the right side of the image well before the actual raw data is clipped. You can make your histogram less inaccurate by choosing the widest color space available (usually Adobe 1998 RGB), the lowest contrast setting available, and getting the right white balance. You can do that last by either buying a camera whose automatic white balance is reasonably accurate, or taking some care to manually set the correct white balance. It may seem silly to set white balance that will have no effect on the data in your raw file, but you will see a less wonky histogram.
Nothing you can do will give you precise information about what’s going on with the horizontal axis. Are you within a stop of clipping? Half a stop? There’s no way to tell accurately. However, there are ways to get an idea, and more on that in a later post. I don’t know of an effective workaround at the left side of the histogram, where you’d like to get an idea of how well populated the buckets are so you can see if the shadows are getting crunchy, but there’s a way to see what’s going on after the fact, and, armed with that information, you may get a feel for the left side.
Stay tuned for more on this. Send in questions and I’ll try to deal with them.


Leave a Reply