• site home
  • blog home
  • galleries
  • contact
  • underwater
  • the bleeding edge

the last word

Photography meets digital computer technology. Photography wins -- most of the time.

You are here: Home / The Last Word / Sensor MTF with a perfect lens

Sensor MTF with a perfect lens

April 21, 2016 JimK Leave a Comment

To a first approximation, the modulation transfer function (MTF) curve for a given lens and a given sensor is the product of the MTF curve for the lens alone times the MTF for the sensor alone. But how do you measure the MTF of a sensor with a perfect lens?

You don’t. You simulate it.

Here’s a set of curves that you might multiply your lens curves by to see what the overall effect might be. This is from a simulation that I wrote, for a perfect — contact printing — lens on a sensor with 100% fill factor.

Details of the sim:

  • Adobe RGB RGGB CFA
  • 16:1 optical scaling
  • Diffraction = 0
  • Gradient-corrected linear interpolation
  • RGB image converted to luminance before running SFR code
  • Burns’ sftmat3 used to compute MTF

aa no aa sfr ideal

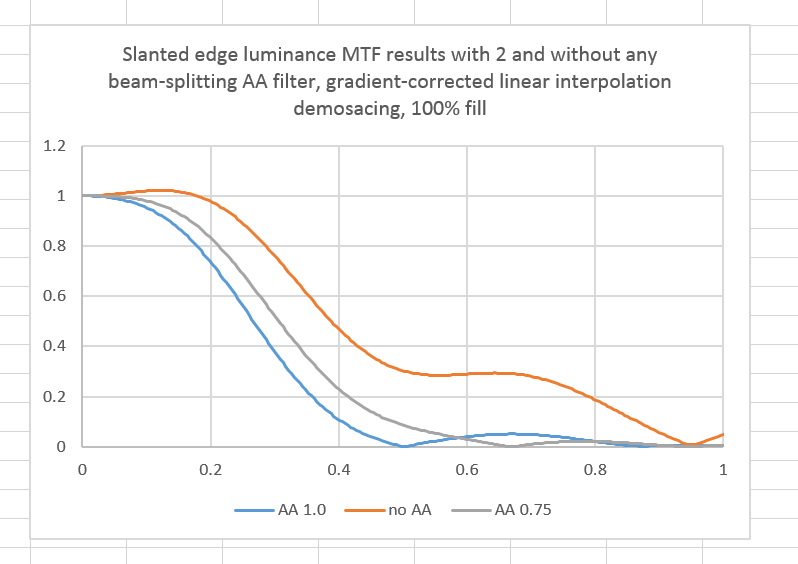
The horizontal axis in in cycles/pixel. The Nyquist frequency is 0.5 cy/px. Two different AA filter are simulated, both of the four-way beam splitting variety. One has a zero at the Nyquist frequency, and one at just below 0.7 cy/px. The bounce at the far right for the no-AA filter curve and the rise above unity on the left of that curve are probably because the optical processing to sampling ratio was too small, but the anomalies could be because of a lack of sophistication in sfrmat3.

You can see that, for a sharp (in this case, very sharp) lens and a high-spatial frequency subject, sizable reduction in aliasing is obtained at some loss in sub-Nyquist contrast.

If you’re used to seeing MTF curves in cycles per picture height instead of cycles per pixel, here’s one for a camera with a 5792 pixel sensor height.

aa no aa sfr ideal cy per pj

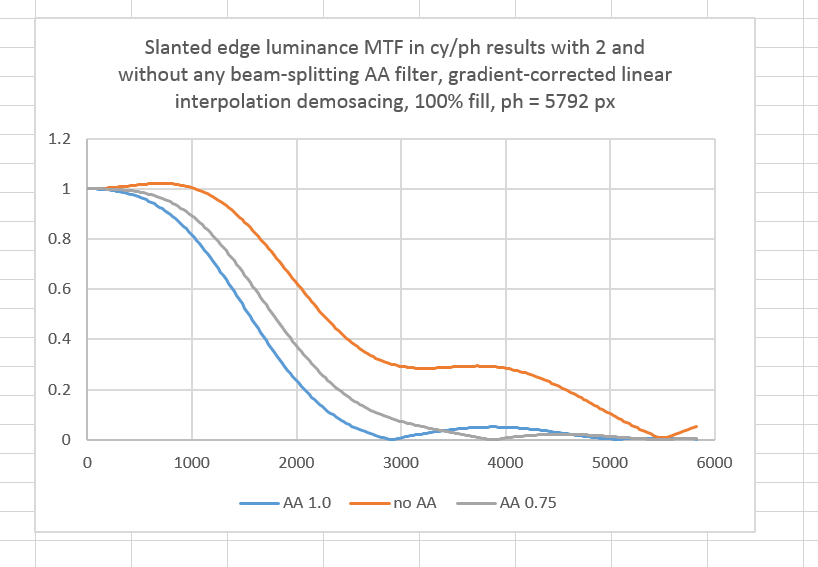
It would be nice if lens vendors would publish MTF curves in this form. Then it would be pretty easy to see how a given lens would perform on any particular camera.

If we use AHD demosaicing, things look quite different:

AHD aa no aa sfr ideal cy per pj

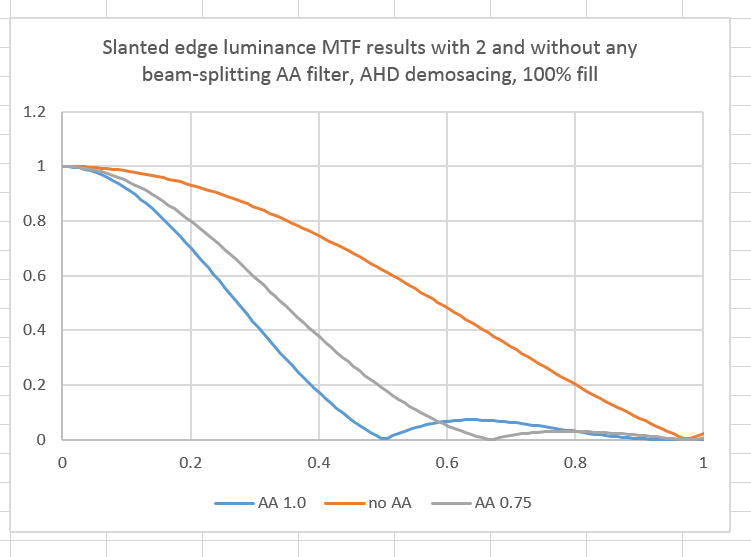
The AA filter is costing us more sharpness, and gaining us more removal of frequencies subject to aliasing.

The Last Word

← A book report — varnish options Towards a macro MTF test protocol →

Leave a Reply Cancel reply

Your email address will not be published. Required fields are marked *

May 2025
S M T W T F S
 123
45678910
11121314151617
18192021222324
25262728293031
« Apr    

Articles

  • About
    • Patents and papers about color
    • Who am I?
  • How to…
    • Backing up photographic images
    • How to change email providers
    • How to shoot slanted edge images for me
  • Lens screening testing
    • Equipment and Software
    • Examples
      • Bad and OK 200-600 at 600
      • Excellent 180-400 zoom
      • Fair 14-30mm zoom
      • Good 100-200 mm MF zoom
      • Good 100-400 zoom
      • Good 100mm lens on P1 P45+
      • Good 120mm MF lens
      • Good 18mm FF lens
      • Good 24-105 mm FF lens
      • Good 24-70 FF zoom
      • Good 35 mm FF lens
      • Good 35-70 MF lens
      • Good 60 mm lens on IQ3-100
      • Good 63 mm MF lens
      • Good 65 mm FF lens
      • Good 85 mm FF lens
      • Good and bad 25mm FF lenses
      • Good zoom at 24 mm
      • Marginal 18mm lens
      • Marginal 35mm FF lens
      • Mildly problematic 55 mm FF lens
      • OK 16-35mm zoom
      • OK 60mm lens on P1 P45+
      • OK Sony 600mm f/4
      • Pretty good 16-35 FF zoom
      • Pretty good 90mm FF lens
      • Problematic 400 mm FF lens
      • Tilted 20 mm f/1.8 FF lens
      • Tilted 30 mm MF lens
      • Tilted 50 mm FF lens
      • Two 15mm FF lenses
    • Found a problem – now what?
    • Goals for this test
    • Minimum target distances
      • MFT
      • APS-C
      • Full frame
      • Small medium format
    • Printable Siemens Star targets
    • Target size on sensor
      • MFT
      • APS-C
      • Full frame
      • Small medium format
    • Test instructions — postproduction
    • Test instructions — reading the images
    • Test instructions – capture
    • Theory of the test
    • What’s wrong with conventional lens screening?
  • Previsualization heresy
  • Privacy Policy
  • Recommended photographic web sites
  • Using in-camera histograms for ETTR
    • Acknowledgments
    • Why ETTR?
    • Normal in-camera histograms
    • Image processing for in-camera histograms
    • Making the in-camera histogram closely represent the raw histogram
    • Shortcuts to UniWB
    • Preparing for monitor-based UniWB
    • A one-step UniWB procedure
    • The math behind the one-step method
    • Iteration using Newton’s Method

Category List

Recent Comments

  • JimK on Calculating reach for wildlife photography
  • Geofrey on Calculating reach for wildlife photography
  • Javier Sanchez on The 16-Bit Fallacy: Why More Isn’t Always Better in Medium Format Cameras
  • Mike MacDonald on Your photograph looks like a painting?
  • Mike MacDonald on Your photograph looks like a painting?
  • bob lozano on The 16-Bit Fallacy: Why More Isn’t Always Better in Medium Format Cameras
  • JimK on Goldilocks and the three flashes
  • DC Wedding Photographer on Goldilocks and the three flashes
  • Wedding Photographer in DC on The 16-Bit Fallacy: Why More Isn’t Always Better in Medium Format Cameras
  • JimK on Fujifilm GFX 100S II precision

Archives

Copyright © 2025 · Daily Dish Pro On Genesis Framework · WordPress · Log in

Unless otherwise noted, all images copyright Jim Kasson.