• site home
  • blog home
  • galleries
  • contact
  • underwater
  • the bleeding edge

the last word

Photography meets digital computer technology. Photography wins -- most of the time.

You are here: Home / The Last Word / Westcott LED panel lighting spectra

Westcott LED panel lighting spectra

January 31, 2018 JimK 2 Comments

The issue of the spectrum of the LED panels that I have been using for the autofocus tests has arisen. In the interests of full disclosure, here are some plots and stats.

First, with the panels set to the 5500K setting that I’ve been using most of the time:


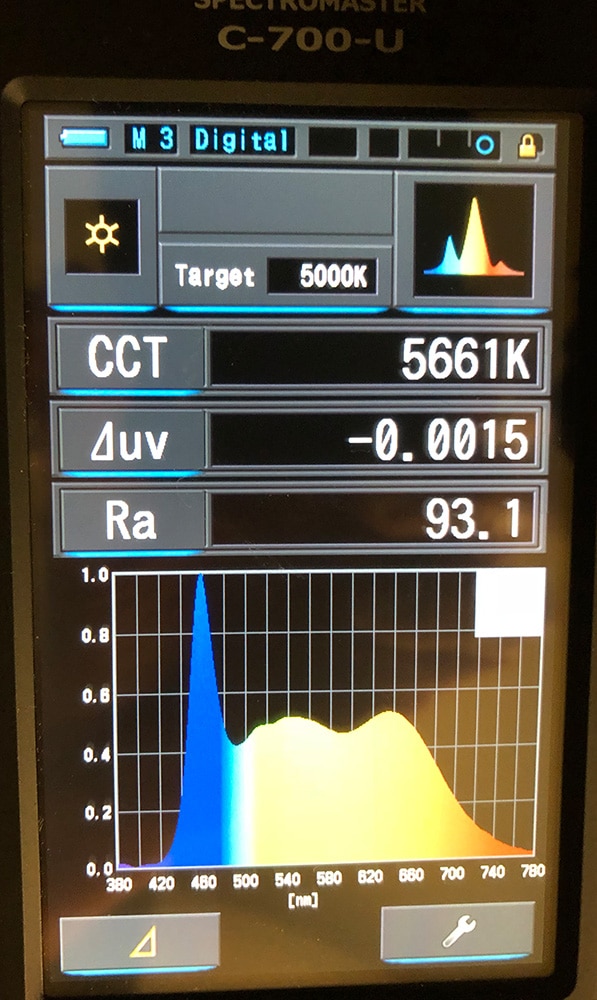
The blue excitation spike is visible. The CRI is a bit over 93, which is not bad. The actual color temperature is about 150 degrees Kelvin over what was set. The white point is very close to the black body arc, being slightly off in the magenta direction.

At 3000K, which I used for one of yesterday’s tests:

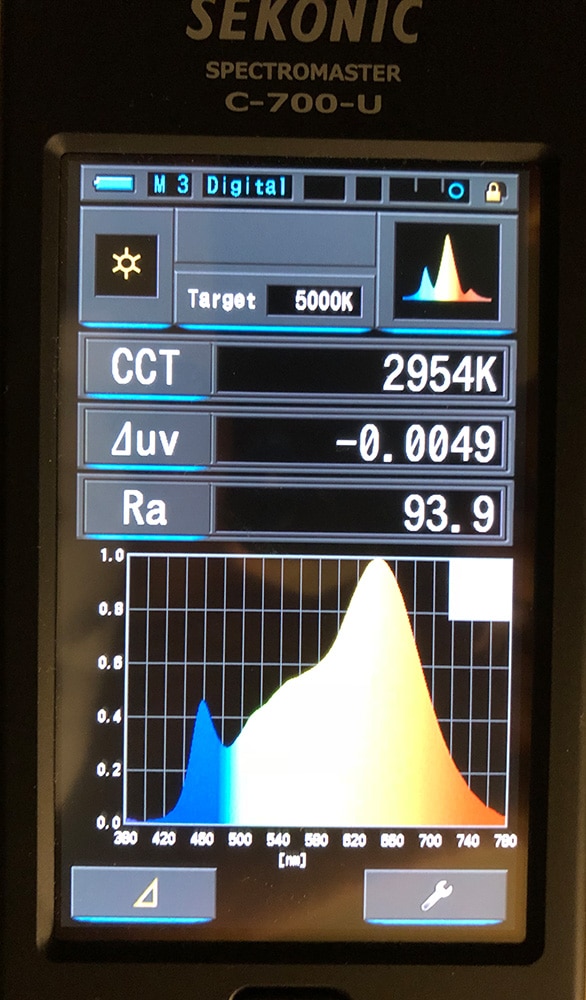
The actual color temperature is about 50 degrees lower than set. The blue spike is relatively smaller. The CRI has increased slightly, to almost 94, and the deviation from the black body curve remains small and in the magenta direction.

At 6000K, which was the other setting I used for yesterday’s tests:

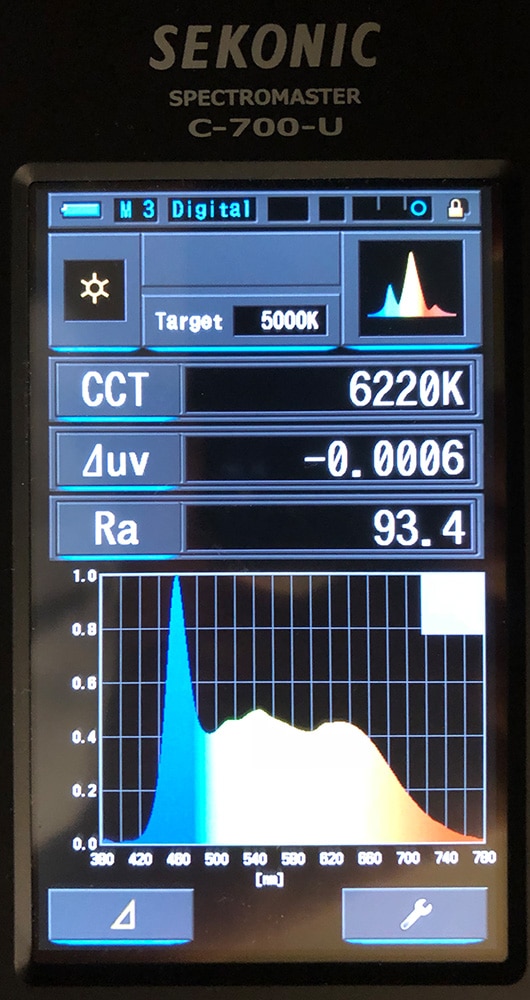
The spike is bigger. The CRI is about halfway between the other two plots, the color temperature is about 200 degrees too high, and the white point is just about dead on the black body curve.

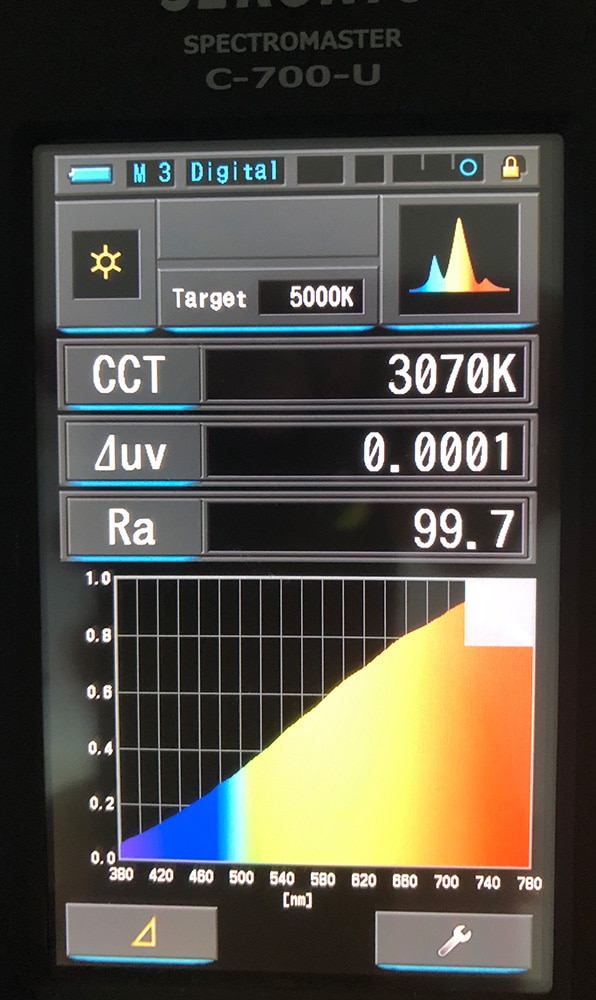
For comparison, here is an actual factual 3000K tungsten bulb:

For what it’s worth…

The Last Word

← D850 with Nikon 200/2 VR I, AF-S and lighting spectrum D850 with Nikon 200/2 VR I, CDAF vs PDAF accuracy →

Comments

  1. AndrewZ says

    March 8, 2018 at 2:04 am

    Seeing as you have a nifty spectromaster 700 is there any possibility of seeing how the glass in the lens alters the spectrum of light received. You often here the term Leica colours so lets see if there is any truth in that. I’ve toyed with getting a nana lambda to do something similar.

    Reply
    • JimK says

      March 8, 2018 at 11:19 am

      Still trying to get the Sekonic computer software to work well enough to download spectra.

      Reply

Leave a Reply Cancel reply

Your email address will not be published. Required fields are marked *

May 2025
S M T W T F S
 123
45678910
11121314151617
18192021222324
25262728293031
« Apr    

Articles

  • About
    • Patents and papers about color
    • Who am I?
  • How to…
    • Backing up photographic images
    • How to change email providers
    • How to shoot slanted edge images for me
  • Lens screening testing
    • Equipment and Software
    • Examples
      • Bad and OK 200-600 at 600
      • Excellent 180-400 zoom
      • Fair 14-30mm zoom
      • Good 100-200 mm MF zoom
      • Good 100-400 zoom
      • Good 100mm lens on P1 P45+
      • Good 120mm MF lens
      • Good 18mm FF lens
      • Good 24-105 mm FF lens
      • Good 24-70 FF zoom
      • Good 35 mm FF lens
      • Good 35-70 MF lens
      • Good 60 mm lens on IQ3-100
      • Good 63 mm MF lens
      • Good 65 mm FF lens
      • Good 85 mm FF lens
      • Good and bad 25mm FF lenses
      • Good zoom at 24 mm
      • Marginal 18mm lens
      • Marginal 35mm FF lens
      • Mildly problematic 55 mm FF lens
      • OK 16-35mm zoom
      • OK 60mm lens on P1 P45+
      • OK Sony 600mm f/4
      • Pretty good 16-35 FF zoom
      • Pretty good 90mm FF lens
      • Problematic 400 mm FF lens
      • Tilted 20 mm f/1.8 FF lens
      • Tilted 30 mm MF lens
      • Tilted 50 mm FF lens
      • Two 15mm FF lenses
    • Found a problem – now what?
    • Goals for this test
    • Minimum target distances
      • MFT
      • APS-C
      • Full frame
      • Small medium format
    • Printable Siemens Star targets
    • Target size on sensor
      • MFT
      • APS-C
      • Full frame
      • Small medium format
    • Test instructions — postproduction
    • Test instructions — reading the images
    • Test instructions – capture
    • Theory of the test
    • What’s wrong with conventional lens screening?
  • Previsualization heresy
  • Privacy Policy
  • Recommended photographic web sites
  • Using in-camera histograms for ETTR
    • Acknowledgments
    • Why ETTR?
    • Normal in-camera histograms
    • Image processing for in-camera histograms
    • Making the in-camera histogram closely represent the raw histogram
    • Shortcuts to UniWB
    • Preparing for monitor-based UniWB
    • A one-step UniWB procedure
    • The math behind the one-step method
    • Iteration using Newton’s Method

Category List

Recent Comments

  • JimK on How Sensor Noise Scales with Exposure Time
  • Štěpán Kaňa on Calculating reach for wildlife photography
  • Štěpán Kaňa on How Sensor Noise Scales with Exposure Time
  • JimK on Calculating reach for wildlife photography
  • Geofrey on Calculating reach for wildlife photography
  • JimK on Calculating reach for wildlife photography
  • Geofrey on Calculating reach for wildlife photography
  • Javier Sanchez on The 16-Bit Fallacy: Why More Isn’t Always Better in Medium Format Cameras
  • Mike MacDonald on Your photograph looks like a painting?
  • Mike MacDonald on Your photograph looks like a painting?

Archives

Copyright © 2025 · Daily Dish Pro On Genesis Framework · WordPress · Log in

Unless otherwise noted, all images copyright Jim Kasson.