This is a continuation of a test of the following lenses on the Sony a7RII:
- Zeiss 85mm f/1.8 Batis.
- Zeiss 85mm f/1.4 Otus.
- Leica 90mm f/2 Apo Summicron-M ASPH.
- AF-S Nikkor 85mm f/1.4 G.
- Sony 90mm f/2.8 FE Macro.
The test starts here.
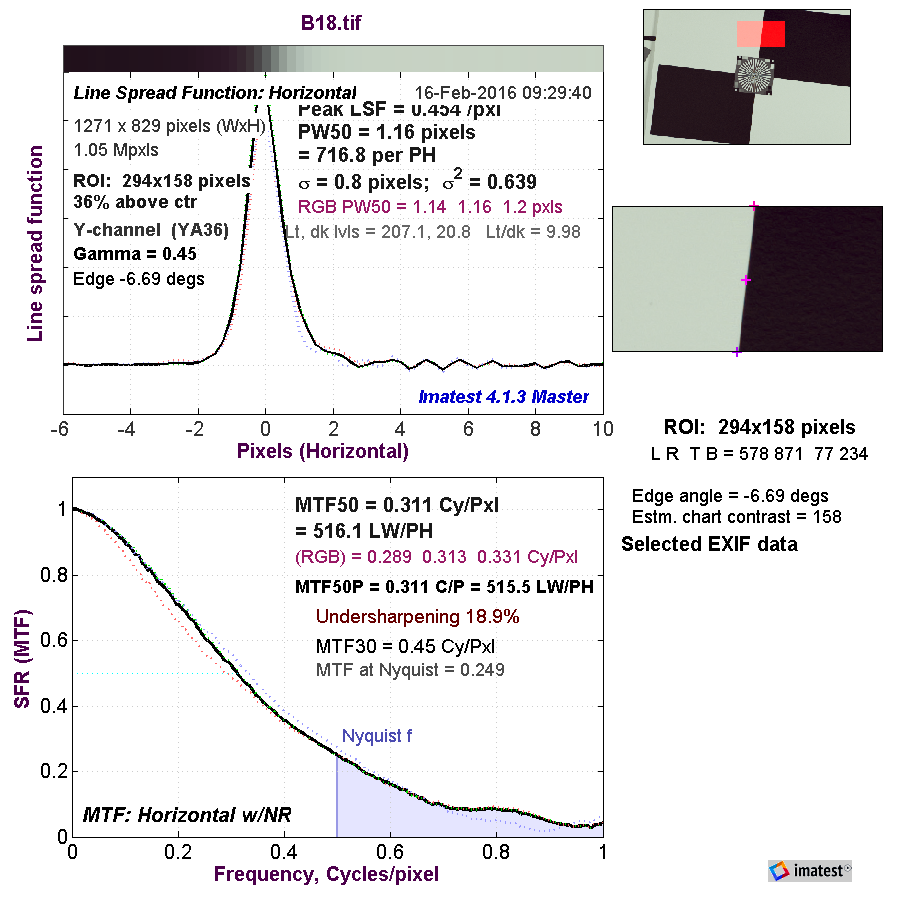
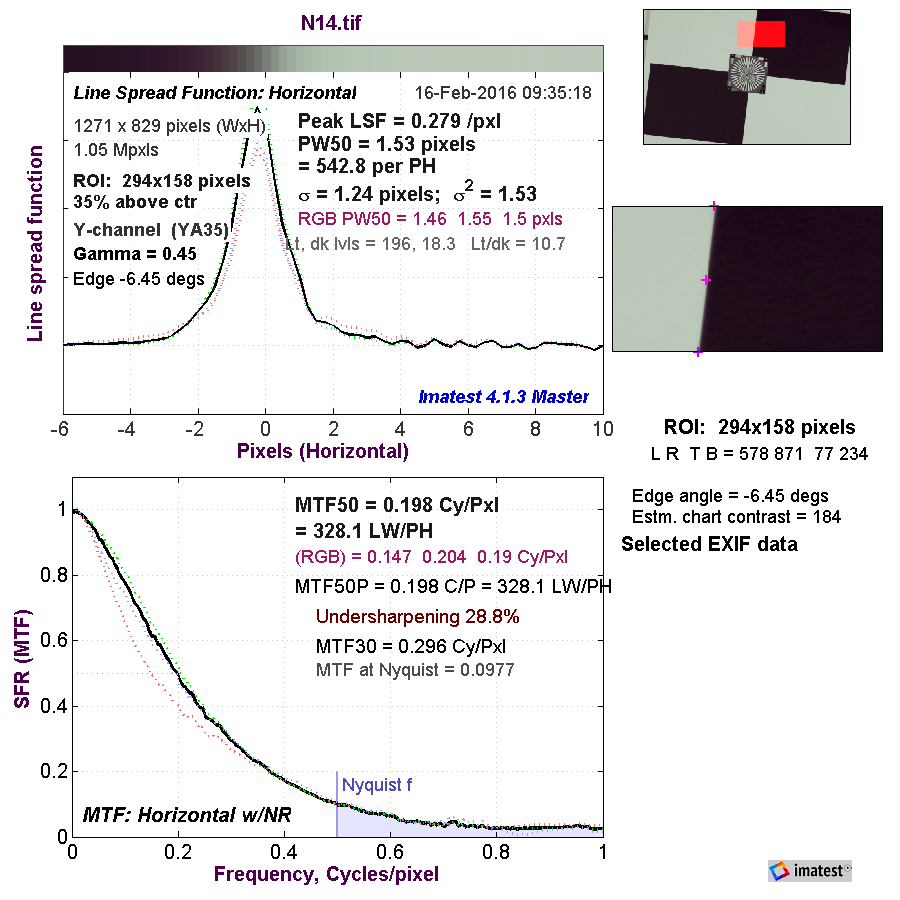
A reader thought that point spread functions (PSFs) might be better for analyzing chromatic aberration. Imatest can’t do those, but it can do the one-dimensional cousin, the line spread function (LSF).
I gave it a try. Batis wide open, on-axis vertical edge:
Nikon wide open, same edge:
The first thing that’s wrong is that Imatest writes text over the part of the graph you really want to see. The second thing is that I don’t think this is as intuitive as the other CA plots we’ve been looking at.
[Addendum follows}
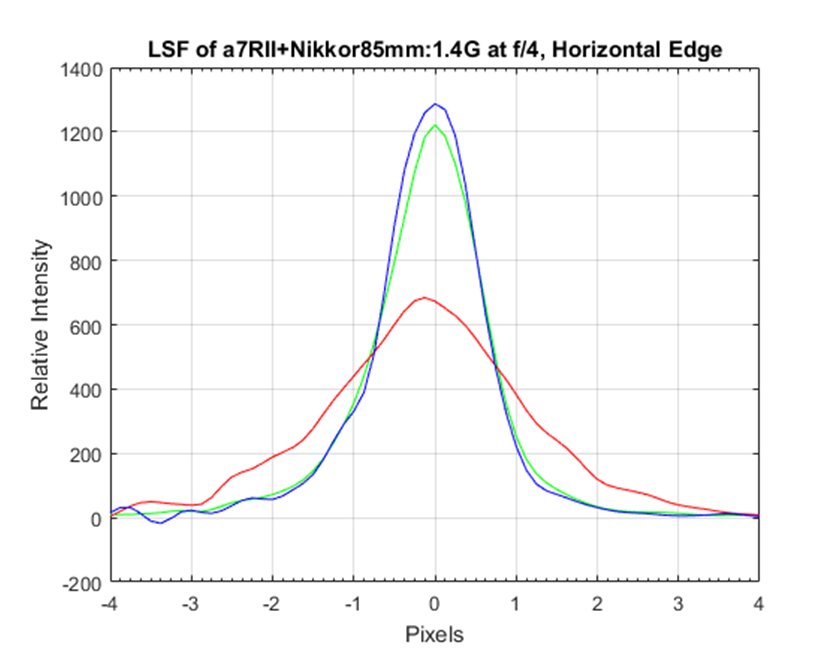
Jack Hogan sent me a LSF that he did with MTF Mapper that doesn’t have text all over it.
I can see that it’s telling me that the blue is the sharpest, followed by the green, with the red far in arrears. I can’t tell what it’s saying about CA though, except for the slight shift to the left for the red layer. The location of the peaks may be a good indication of how much shift there is with wavelength, but I’m at a loss to look at a curve like this and say how visible the CA is. Anybody want to help out?


CarVac says
Indeed I really don’t like the presentation here. You could simplify it by simply rendering it as an image with the actual brightness values, rather than a graph.
Erik Kaffehr says
Hi,
I think Jack’s plot is illustrative, one possible interpretation may be that red is spread over a larger area than blue and green. That may be caused by red (long wave lengths) having different focus than short wave lengths.
I feel that in engineering a good graph can say more than a thousand pictures. NASA of course doesn’t think so, they present a lot of lovely images of planets detected by Kepler instead of the curves.
🙂 Erik 🙂
CarVac says
Based on the addendum, you should make a 2d graph of the brightness distributions of the line spread function as you focus bracket. That’ll show when you have green OOF on one side and red/blue OOF more on the other side.
Jim says
That sounds like a good way to get a more direct handle on LoCA.