This is a continuation of a report on new ways to look at depth of field. The series starts here:
One of the things that I’ve been meaning to get to is better modeling of the on-axis performance of a really good lens. I’ve taken as my exemplar the Zeiss Otus 85mm f/1.4 ZF.2. My old model was pretty good from f/8 on down, but was too optimistic at wider apertures.
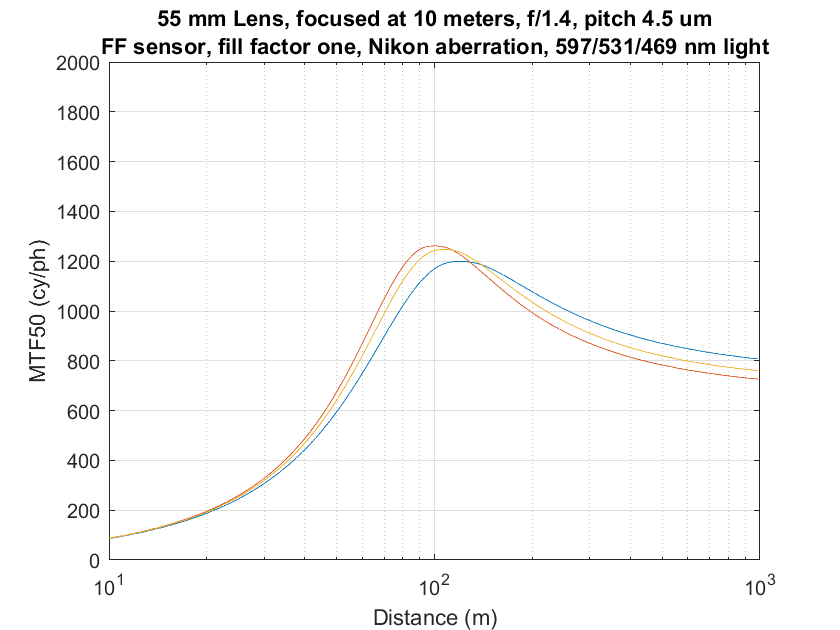
Now that I’ve got a pretty good defocusing/diffraction algorithm, it seemed like a good time to work on the rest of the lens. First, I added longitudinal chromatic aberration. That is not material for the Otus 85, but is for other lenses, so I modeled it while I was working on the code. After getting advice from Jack Hogan, I picked principle wavelengths of 597, 531, and 469 nanometers for the red, green, and blue planes respectively. After a little tweaking, here’s what I got wide open:
Compare those to the curves here. Note the distance scale runs the other way on those curves.
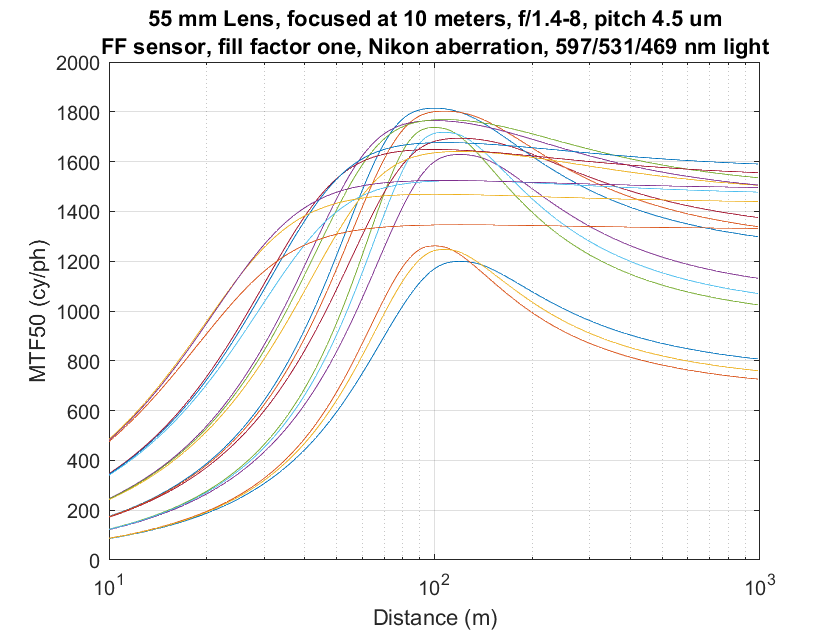
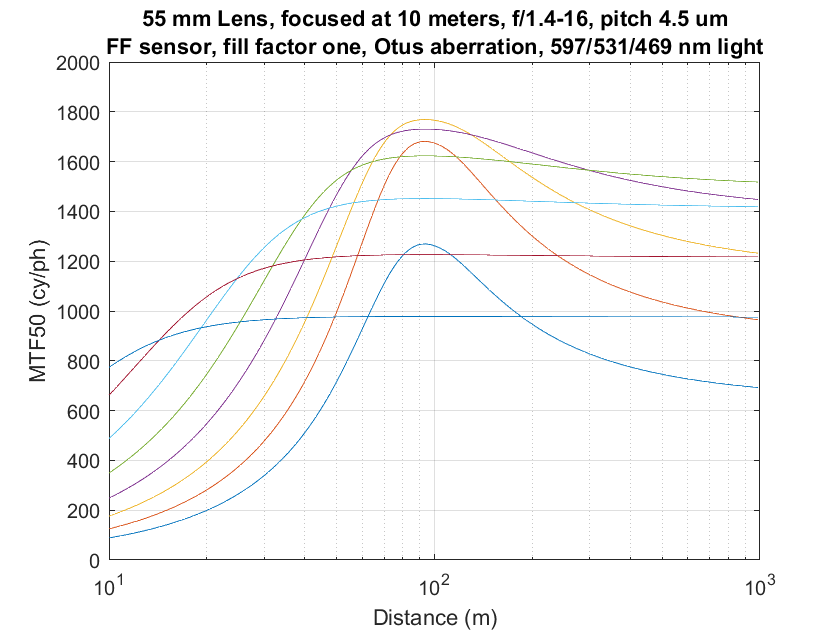
Then, with a big, big assist from Alan Robinson, I modeled the aberration blur as a function of aperture, and ran a set of curves:
It’s easier to see if we plot the combined MTF50s for each f-stop rather than each color plane. I used Jack Hogan’s formula for combining the color planes:
combined MTF50 = (Red MTF50 + 2 * Green MTF50 + Blue MTF50) / 4
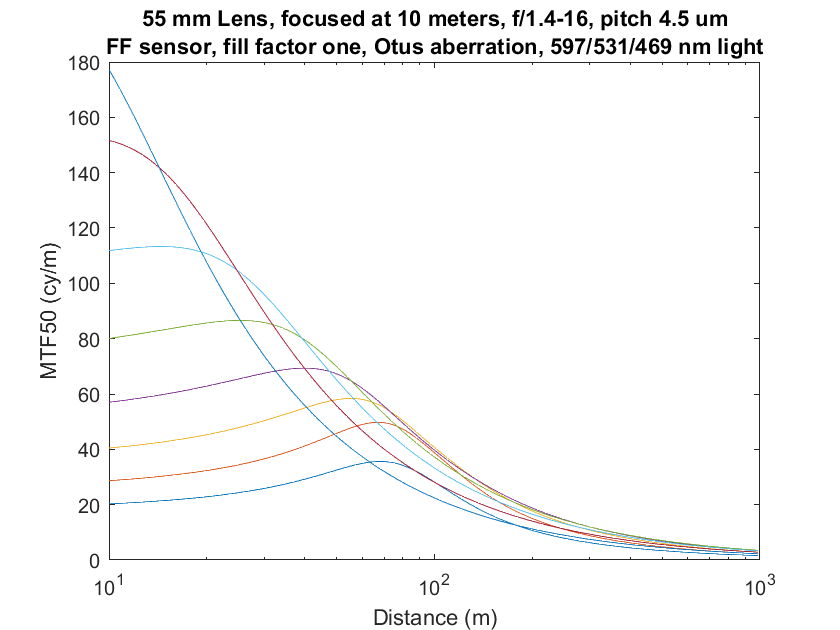
And, for what it’s worth, in the object field:
The model could be tweaked further, but that’s better than it has to be for the DOF management studies.


[…] Yesterday, I modeled a really great lens, the Zeiss Otus 85/1.4 ZF.2, and ran a set of depth of fiel…. […]