This is a continuation of — and a sidebar to — the development of a simple, relatively foolproof, astigmatism, field curvature, and field tilt test for lens screening. The first post is here.
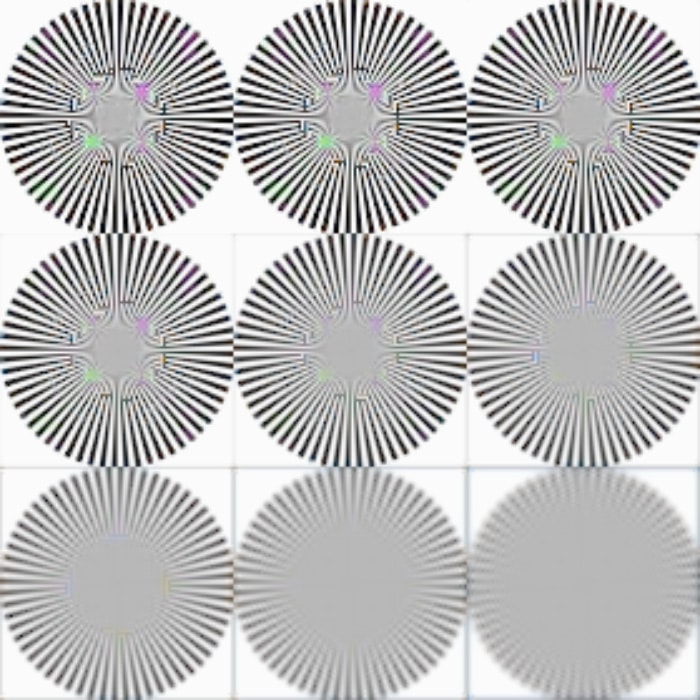
I took the simulator and set it up for a camera with a 5.3 um pitch, 60% fill factor, and a diffraction-limited lens. Starting at f/2, I made a run stopping down a full stop at each iteration. I fed the sim raised-sinusoid 60-spoke Siemens Stars. With AHD demosaicing, this is what resulted:
The top row is f/2, f/2.8, and f/4. You can see that there’s not much difference across those apertures. The next row is f/5.6, f/8, and f/11. On good lenses, those stops are often pretty close to diffraction-limited, so that’ probably the level of performance you’ll see with a real lens. The bottom row is f/16, f/22, and f/32. Diffraction is having a serious effect at these apertures. Note that, if eliminating all vestiges of false color is your aim, you’ll have to stop down to f/11 to do that.
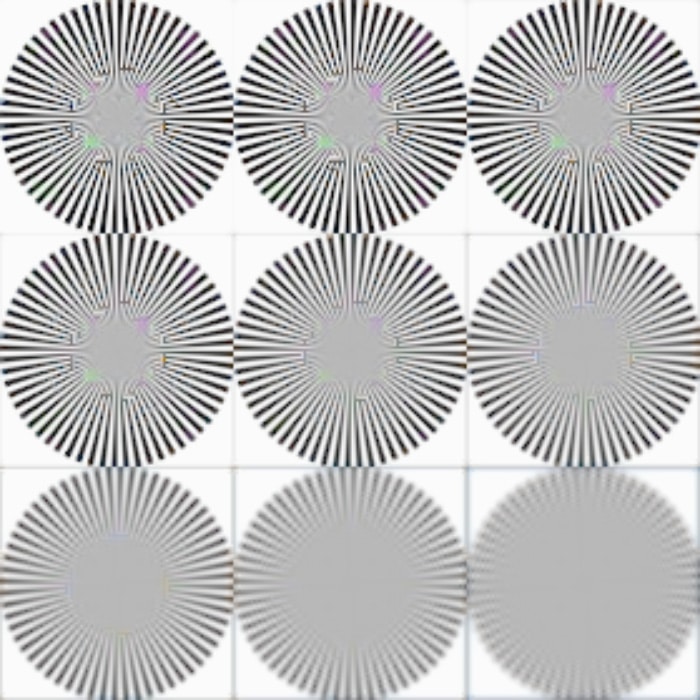
Now let’s look at what happens if we do a run with everything the same except increasing the fill factor to 100%
There is a big effect on the top row. The changes in the middle row — let’s call that the realistic row — are more subtle. f/4 and f/5.6 show more aliasing and more above-Nyquist contrast. At f/11, the differences lessen, and at f/22 and f/32, they are virtually gone.
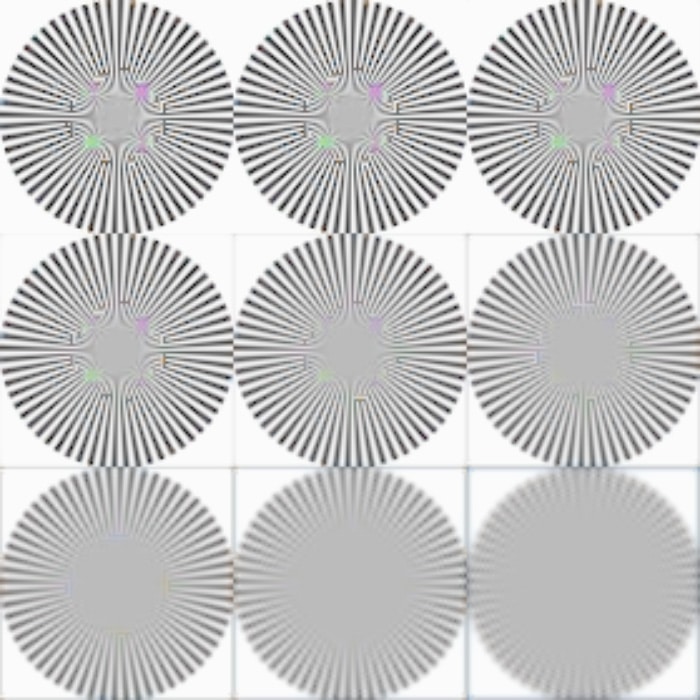
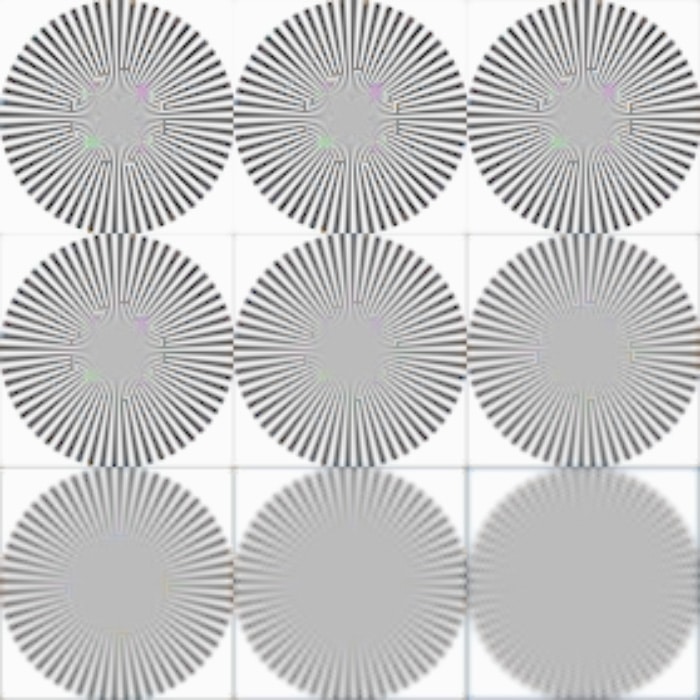
If we use a binary star as the target, the differences are more striking:


There is a significant gain in below-Nyquist contrast at f/8 and wider. Of, course, TANSTAAFL: the aliasing is worse, too.


Leave a Reply