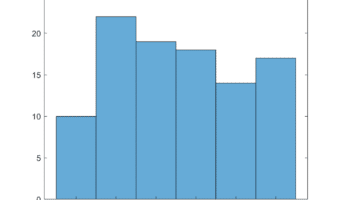
Around the turn of the 20th century, Karl Pearson, an English mathematician and statistician, invented the histogram as a way of presenting data. Originally, the histogram was a kind of bar chart, with the x-axis divided into intervals — now called buckets or bins — and a bar for each bin indicating how many items… [Read More]
