• site home
  • blog home
  • galleries
  • contact
  • underwater
  • the bleeding edge

the last word

Photography meets digital computer technology. Photography wins -- most of the time.

You are here: Home / The Last Word / Another medium tele test — color stats

Another medium tele test — color stats

March 9, 2016 JimK Leave a Comment

This is a continuation of a test of the following lenses on the Sony a7RII:

  • Zeiss 85mm f/1.8 Batis.
  • Zeiss 85mm f/1.4 Otus.
  • Leica 90mm f/2 Apo Summicron-M ASPH.
  • AF-S Nikkor 85mm f/1.4 G.
  • Sony 90mm f/2.8 FE Macro.

The test starts here.

Yesterday, I showed chromaticity shifts among the test lenses with development in Lightroom with simple white balance and exposure compensation. Today I’d like to show some of the statistics for the five test images:

med tele color stats

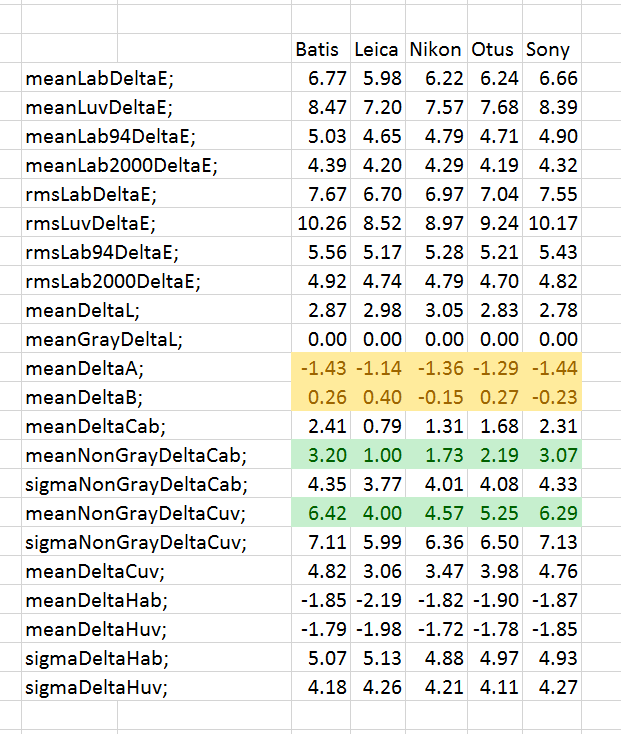
I’m going to ignore all the data except for the four rows shaded in color.

The ocher shading shows aggregate chromaticity shift in a* (cyan-red) and b* (blue-yellow). The white balancing for each image to one of  the gray patches would tend to minimize this, and It looks like the variations are quite small. That means that any overall color cast introduced by any lens is pretty much gone.

The green shaded rows show aggregate chroma shifts in both CIELab (upper) and CIELuv (lower). Positive numbers indicate more chroma.  The Leica results are the least vivid, and the Batis and Sony ones the most vivid. I suspect that this is the result of Lr doing some special processing when developing files with tags in the metadata indicating that they were made with these lenses.

A smoking gun?

Lr bi lens profile

Anyway, the effects seem to be small.

One assumption that might make sense is that flare is reducing the chroma in images made with some of the lenses. The problem with that is that the Otus, which has the least flare, is midpack for average chroma.

The Last Word

← Another medium tele test — animated color Another medium tele test — white balance →

Leave a Reply Cancel reply

Your email address will not be published. Required fields are marked *

May 2025
S M T W T F S
 123
45678910
11121314151617
18192021222324
25262728293031
« Apr    

Articles

  • About
    • Patents and papers about color
    • Who am I?
  • How to…
    • Backing up photographic images
    • How to change email providers
    • How to shoot slanted edge images for me
  • Lens screening testing
    • Equipment and Software
    • Examples
      • Bad and OK 200-600 at 600
      • Excellent 180-400 zoom
      • Fair 14-30mm zoom
      • Good 100-200 mm MF zoom
      • Good 100-400 zoom
      • Good 100mm lens on P1 P45+
      • Good 120mm MF lens
      • Good 18mm FF lens
      • Good 24-105 mm FF lens
      • Good 24-70 FF zoom
      • Good 35 mm FF lens
      • Good 35-70 MF lens
      • Good 60 mm lens on IQ3-100
      • Good 63 mm MF lens
      • Good 65 mm FF lens
      • Good 85 mm FF lens
      • Good and bad 25mm FF lenses
      • Good zoom at 24 mm
      • Marginal 18mm lens
      • Marginal 35mm FF lens
      • Mildly problematic 55 mm FF lens
      • OK 16-35mm zoom
      • OK 60mm lens on P1 P45+
      • OK Sony 600mm f/4
      • Pretty good 16-35 FF zoom
      • Pretty good 90mm FF lens
      • Problematic 400 mm FF lens
      • Tilted 20 mm f/1.8 FF lens
      • Tilted 30 mm MF lens
      • Tilted 50 mm FF lens
      • Two 15mm FF lenses
    • Found a problem – now what?
    • Goals for this test
    • Minimum target distances
      • MFT
      • APS-C
      • Full frame
      • Small medium format
    • Printable Siemens Star targets
    • Target size on sensor
      • MFT
      • APS-C
      • Full frame
      • Small medium format
    • Test instructions — postproduction
    • Test instructions — reading the images
    • Test instructions – capture
    • Theory of the test
    • What’s wrong with conventional lens screening?
  • Previsualization heresy
  • Privacy Policy
  • Recommended photographic web sites
  • Using in-camera histograms for ETTR
    • Acknowledgments
    • Why ETTR?
    • Normal in-camera histograms
    • Image processing for in-camera histograms
    • Making the in-camera histogram closely represent the raw histogram
    • Shortcuts to UniWB
    • Preparing for monitor-based UniWB
    • A one-step UniWB procedure
    • The math behind the one-step method
    • Iteration using Newton’s Method

Category List

Recent Comments

  • JimK on How Sensor Noise Scales with Exposure Time
  • Štěpán Kaňa on Calculating reach for wildlife photography
  • Štěpán Kaňa on How Sensor Noise Scales with Exposure Time
  • JimK on Calculating reach for wildlife photography
  • Geofrey on Calculating reach for wildlife photography
  • JimK on Calculating reach for wildlife photography
  • Geofrey on Calculating reach for wildlife photography
  • Javier Sanchez on The 16-Bit Fallacy: Why More Isn’t Always Better in Medium Format Cameras
  • Mike MacDonald on Your photograph looks like a painting?
  • Mike MacDonald on Your photograph looks like a painting?

Archives

Copyright © 2025 · Daily Dish Pro On Genesis Framework · WordPress · Log in

Unless otherwise noted, all images copyright Jim Kasson.