This is one in a series of posts on the Nikon Z6 and Z7. You should be able to find all the posts about that camera in the Category List on the right sidebar, below the Articles widget. There’s a drop-down menu there that you can use to get to all the posts in this series; just look for “Nikon Z6/7”.
There has recently been some controversy about the relative noise behavior of the Nikon Z6 and Z7 in deep shadows. I am addressing those differences in a series of posts which will include both quantitative results and visual ones. The series starts here.
I’ve been at this for more than a week. A lot of that time has been spent writing programs that will be generally useful to me, but much of it has only served to identify, measure quantitatively, and show examples of the visual differences of the shadow noise in the Nikon Z6 and Z7. I’m ready to draw some conclusions from all that work.
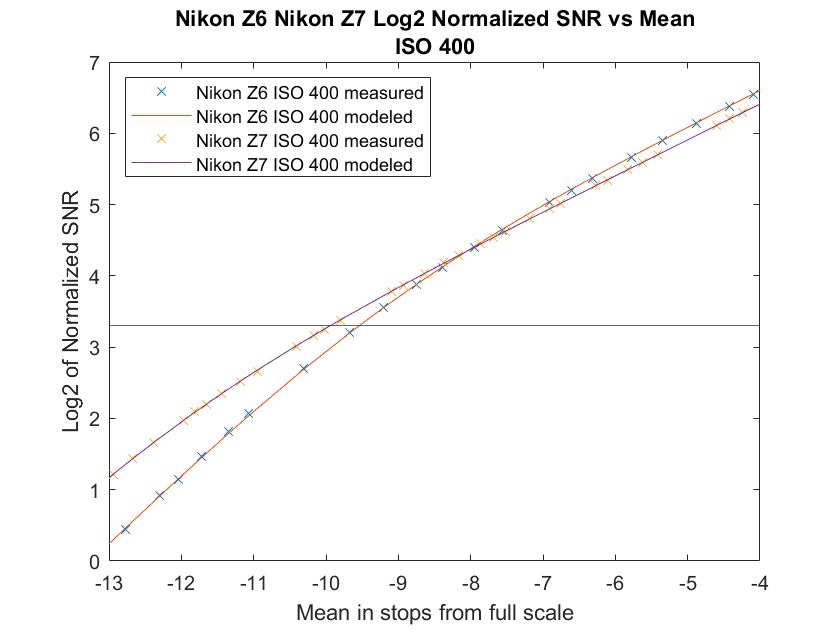
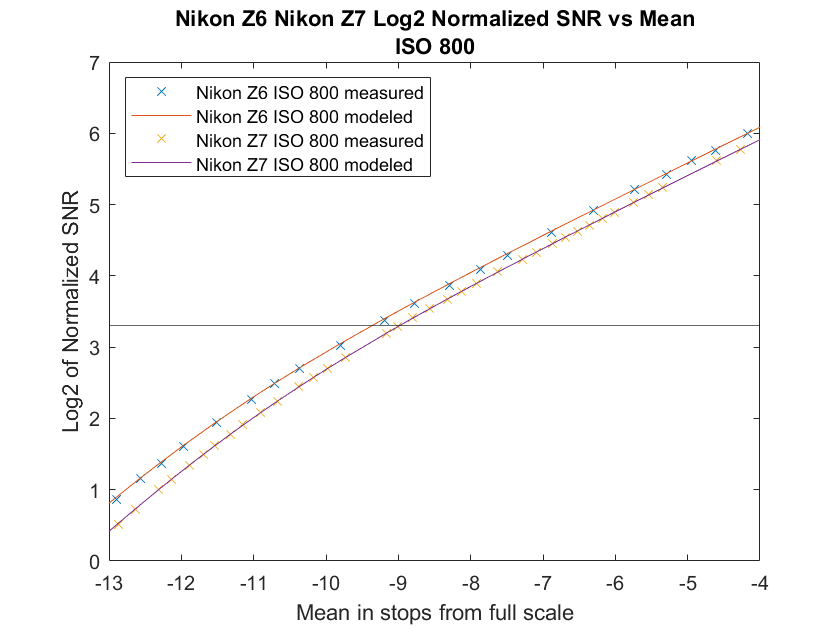
1) There isn’t much difference, either visually or numerically, between the noise in raw files from the two cameras. The two I’ve been using for testing average within 1% of each other on green channel levels at identical ISO and exposure settings. White balance is not quite that close, but is also similar. The normalized signal-to-noise ratio (SNR) curves at identical ISOs for the two cameras aren’t that different, With the Z6 coming out ahead at low ISOs, dropping back as the Z7 switches to high-conversion-gain mode at ISO 400, and pulling further ahead as the Z6 gets to do its conversion gain trick at ISO 800 and above. The biggest differences are about half a stop.
2) As a corollary to the above, the Internet sturm und drang that I’ve seen about the Z6 being a far better performer at high ISOs than the Z7 is at best misleading and likely flat-out wrong. Maybe it’s the result of copy variation. More likely than that is it comes from poorly setup comparisons. Possibly it comes from color profile variations. It might come from improper resolution normalization. Maybe observer bias is present. There could be black-point issues. It could be all those things and more, singly or in myriad combinations, but whatever the reasons, I couldn’t show much in the way of differences once I got the playing field reasonably level. I should note that I only tested one copy of each camera, but what are the odds that the two cameras that I tested turned out to be so close in sensitivity, agree so well with other people’s photon-transfer-curve testing, yet are somehow not representative?
3) For the most part, the relative shadow noise doesn’t depend heavily on how deep the shadows are. Here’s an exception:
The Z6 is slightly better in the brighter shadows, and worse in the very deep ones. However, most of the time the horizontal distance betwwen the two curves doesn’t change much with the mean illumination:
4) Using linear methods, Bill Claff’s normalization techniques fairly faithfully reproduce the experience of making and viewing small-sized prints, but they do not account for the more pleasing quality to the noise from higher-resolution cameras that I observed when the noise is visible.
5) Using 8-inch high prints for a reference is not representative of many of the uses of modern, high-resolution cameras. My standard landscape-orientation print height is 15 inches on C-sized (17×22 inch) paper. I print bigger when I can, sometimes more than twice that high. A Z7 image is more than 5500 pixels high. Printed 8 inches high, that’s about 690 pixels per inch (ppi). Canon printers van do 300. Epsons do 360 (the 720 ppi mode is something of a shuck). One of the reasons — the main one, for me — to buy a high-resolution camera is to be able to make big prints.
6) With high-resolution cameras, the Claff SNR — the reference level used to compute Claff Photographic Dynamic Range (PDR) — is deep, deep in the shadows at lower ISOs for high-resolution (and, in this context, even 24 MP is high) cameras. In fact, it’s so near black that it would be unusual for real-world images to need enough shadow lifting to make that noise easily visible.
7) There’s a lot of noise visible at the Claff SNR. More noise than I’d like in my prints.
8) When you put the above three conclusions together, they both lead to a conclusion that the Claff SNR would be more practical if it were higher. I’d like to see it at least double what it is, and maybe 4 or 8 times would be better.
9) A corollary to the above is that in high-resolution cameras, Claff PDR emphasizes read noise performance more than I’d like and photon noise performance less.
10) Because of 3), 8) and 9) don’t matter much for comparing the performance of two cameras.
11) PDR differences between cameras less than half a stop aren’t material. Differences less than a stop don’t matter too much.
12) Visual impressions of raw file noise — and I haven’t demonstrated in this series of posts — has a very high correlation with the numerical results.
13) Visual impressions of demosaiced images are affected in ways that are difficult to control by camera profiles and the choice of raw developing program. They are also in theory affected by the camera spectral response and the color transformations made by the profiles. But when I tweaked the demosaiced images to get the density comparable, the noise was, too.
All in all, I am pretty happy with the utility of the Claff Photographic Dynamic Range for evaluation of camera shadow noise.
Next, I’m going to look at how nonlinear noise reduction plays into this. All of the testing in this series has up to now used no noise reduction. When I did simulation testing many years ago, I found the nonlinear noise reduction favored the higher-resolution cameras. But that was for dramatic differences in resolution. is the difference between the Z6 and the Z7 enough for that effect to be significant? And how should I control for sharpness reduction? I’ve got to do some thinking before I jump into the experimenting.


>> (the 720 ppi mode is something of a shuck) <<
Can you elaborate on this?
I should say that I've done extensive comparative testing of 360 vs 720 on my P800 , using pictures, both monochrome and color, with highly-detailed content rather than resolution targets. But I'm eager to understand better what's going on underneath the hood and to correlate that with what I see.
I’m not saying it doesn’t work, but that you don’t get 720 resolvable pixels per inch in both directions. Have a look here:
https://blog.kasson.com/technical/printing-at-28801440-dpi/
https://blog.kasson.com/technical/controlling-resampling-in-the-epson-driver/
I’ve informally tested more modern Epson printers with similar results.
OK, thanks – I’d seen those back when you first posted them .
So I’ll just add, long-time lurker here – many thanks for all the time you’ve spent over the years to write up, share and discuss your findings!
Surprising you didn’t mention dot gain. It’s much greater on inkjet than in offset printing. Inkjet printer dpi specifications tell you more about dot placement.
The technical definition of dot gain doesn’t apply to inkjet, but I take your meaning. There is a difference between addressibility and the size of the feature created when the marking engine deposits a single drop on the substrate, and that varies in strange ways in the presence of other inks being sprayed near that location, adn, of course, some printers have variable drop size. A couple of decades ago, the conventional wisdom was that we would have sub-picoliter drops long before now, but that didn’t happen.
I think there’s a market limit for going further, as in who would buy the printers. I probably should’ve mentioned ink viscosity, or spreading, though I wasn’t sure if those were good descriptions for discussion (I don’t know whether you have commercial printing experience), hence “dot gain”. I’ve long thought the inkjet manufacturers to be misleading in their specifications, such as drops can be as small as __ picolitres.
Temperature and relative humidity also affect ink spreading. Paper coating and surface texture is another, as are whiteness and brightness. I probably have way too many samples of paper.
Anyway, many factors can affect the final printed image, beyond the quality of the image file before it’s printed. It’s not practical to test various printers, nor is it cost effective. I suppose it’s like the oft stated disclaimer that results may vary.
I do have commercial printing experience, which is where the term dot gain properly applies. Since dot size in um is not specified by the inkjet vendors, it can’t gain size over the spec. But you and I both agree that the inkjet ink spreads out on the paper, and that that spreading depends on a myriad of things, not just the drop volume in picoliters. Most people who print know that, at least to some degree, since it is widely known that matte paper won’t hold detail like glossy paper. The only practical way that I know for a person who’s printing to deal with this is make test sheets from synthetic resolution targets and inspect them with a microscope or a strong loupe.
In order to get variable dot sizes, the orifice doesn’t physically change. That may be why the inkjet companies specify picolitres over microns. I never got a straight answer from any of them at printing industry trade shows, though they would talk up the variability of paper, and other factors like humidity. Some of them didn’t like me using a printer’s loupe to view samples.
I’ve probably looked at too many targets, on too many different types of papers, from too many printing methods. When proofing, it’s often that “close enough” is the choice. Colour accuracy can be more important to some clients than edge definition. I have yet to see a good standardized test of inkjet printers, though perhaps I missed one recently?
The size of the orifice on an inkjet printer doesn’t have all that much to do with the size of the droplet. But the situation is different in offset lithography. The plates — when used — have dots of certain sizes on them. But the size of that dot is larger on the paper because of mechanical action by the press on the ink after it gets there, in addition to some slight spreading after that. Dot gain is the ratio of the area on the paper over the area on the plate minus one. With inkjet, there’s no way to form the denominator in that equation.
I’ve not seen any tests of the image microstructure produced by various inkjet printers.