This is one in a series of posts on the Fujifilm GFX 100. You should be able to find all the posts about that camera in the Category List on the right sidebar, below the Articles widget. There’s a drop-down menu there that you can use to get to all the posts in this series; just look for “GFX 100”.
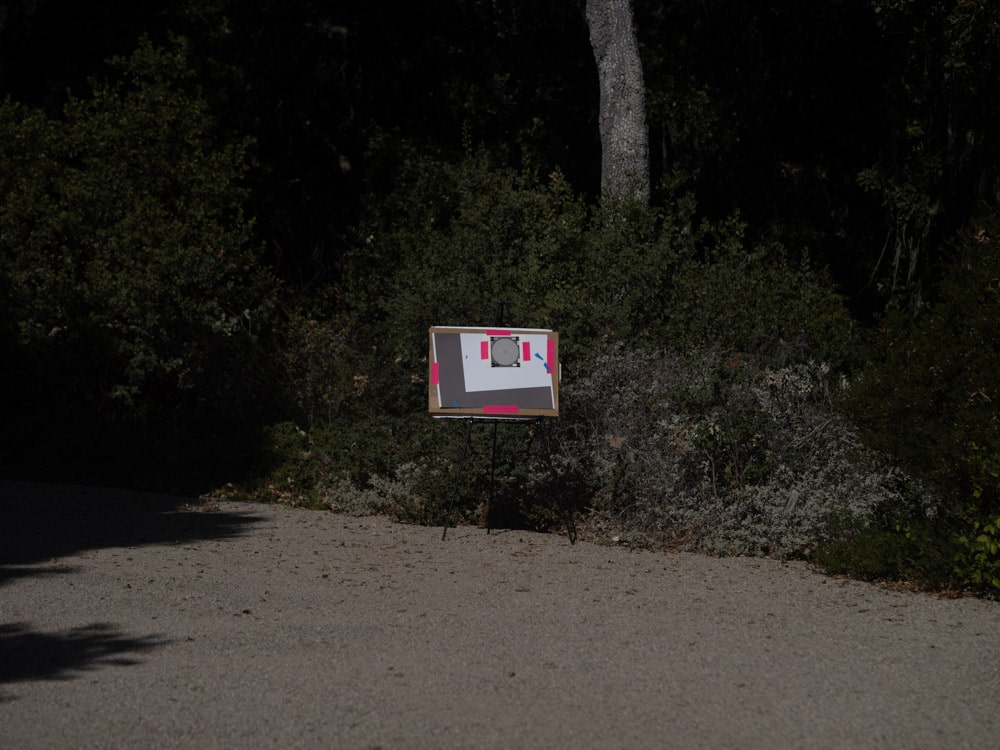
I’ve previously tested the Fujifilm GFX 100 IBIS with the 110mm f/2 lens. I was seated for those tests, and I didn’t test shutter speeds that were low enough to find the place where the IBIS couldn’t handle the camera motion. I vowed to try again. This time I was standing, which made me less stable. I also wanted to try higher shutter speeds, since there have been questions about the IBIS having a deleterious effect at those speeds. Needing to go to higher shutter speeds forced me out of my studio environment. I set up on a sunlit target with two low-contrast slanted edges:
Before, I varied the light level to change shutter speeds. I can’t do that outside, so I used a variable neutral-density filter on the lens.
Here are the details of the test conditions:
- AF-C
- Medium spot, centered
- Continuous low drive mode
- EFCS
- Lossless compressed Raw
- ISO 100
- f/4
- Exposure mode A, center weighting
- 77 mm Heliopan variable neutral density filter
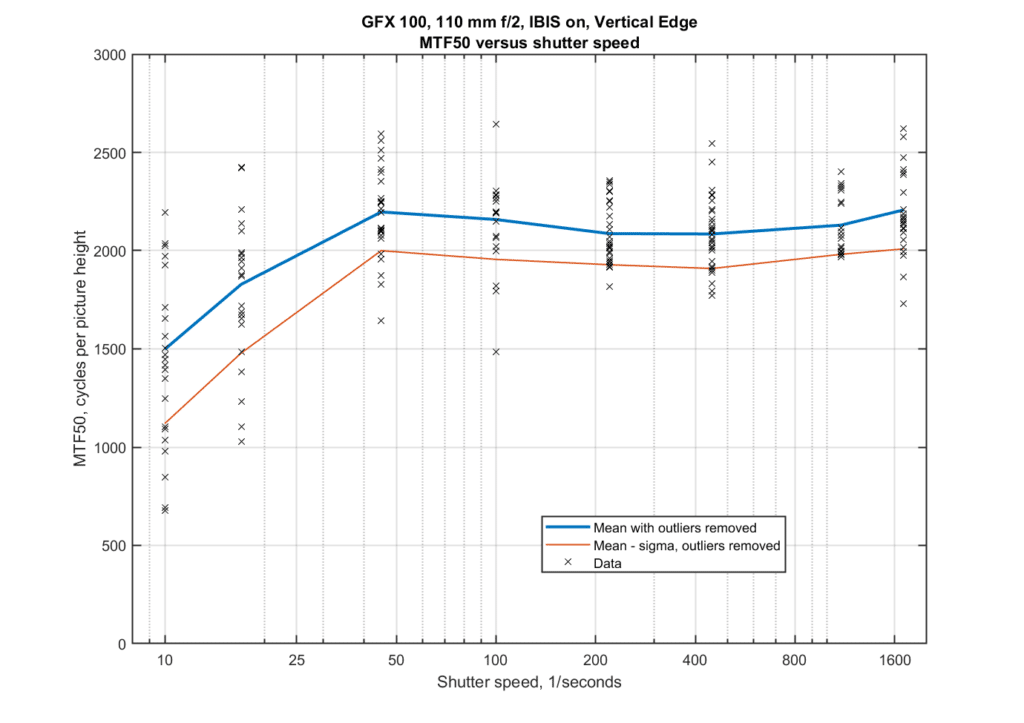
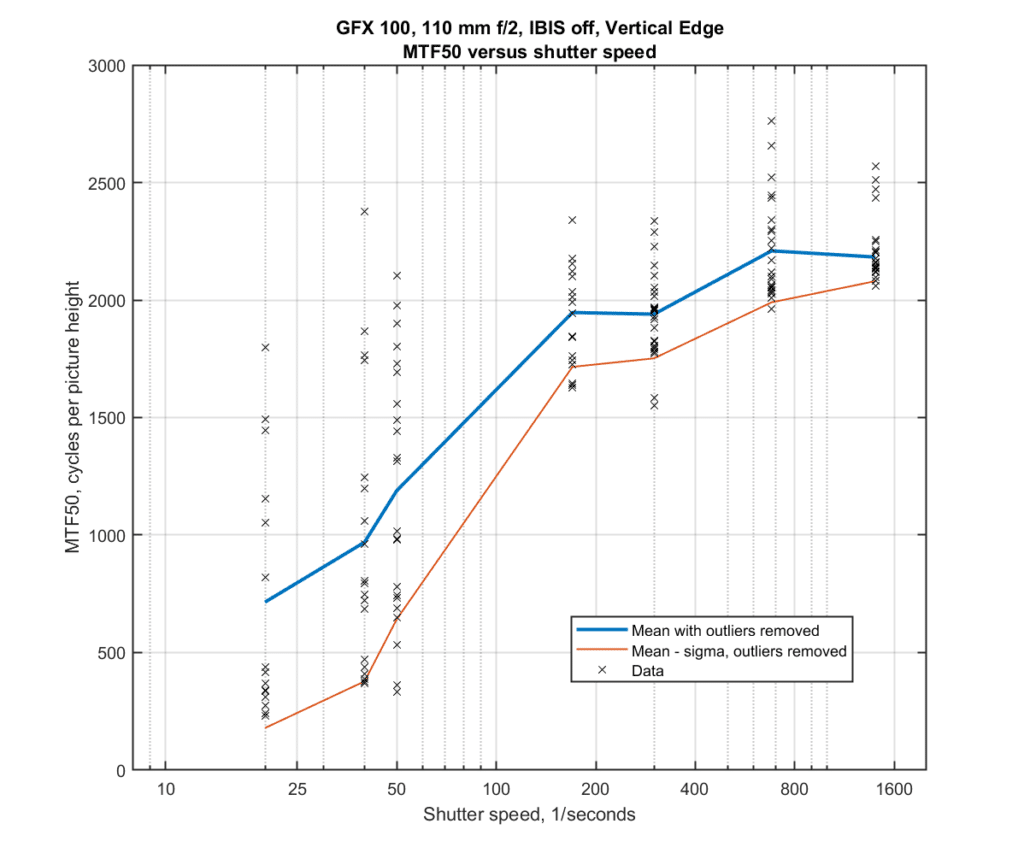
With IBIS on, set the filter to low attenuation, which gave me a shutter speed of about 1/1600 second. I made about 25 continuous-drive exposures, turned the filter down about a stop, and did it again. I kept on doing that until about 1/10 second, then turned IBIS off and ran the series again, this time stopping at 1/25 second (no point in being silly about this).
I ended up with about 400 images. I developed them in Lightroom, with default settings except for the following:
- White balance set to daylight
- Adobe monochrome profile
- Sharpening turned off
- Noise reduction turned off
Using my automatic registration program, I adjusted the cropping in Lightroom for each image so that they were centered. I computed the MTF50 — a proxy for sharpness — for all the images with Imatest with the region of interest being a horizontal edge (Just to make sure, I also looked at vertical edges, with about the same results, but those data aren’t presented here). Imatest spit out the data in cycles per pixel. With my new Matlab code, I converted that to cycles per picture height. For the statistics calculations, I removed outliers, which I defined as points more than two standard deviations away from the mean after conversion of the MTF50 samples with a logarithmic nonlinearity.
The vertical axis is the MTF50 in cycles per picture height. The horizontal axis is the denominator of the shutter speed — 1/100 second is plotted as 100. The heavy lines are the mean (aka mu, aka average) values. The thinner lines are the mean minus the standard deviation (aka sigma). The black x’s are the individual exposures, including the outliers removed from the data set used for the statistical calculations.
With IBIS off, things don’t look so good:
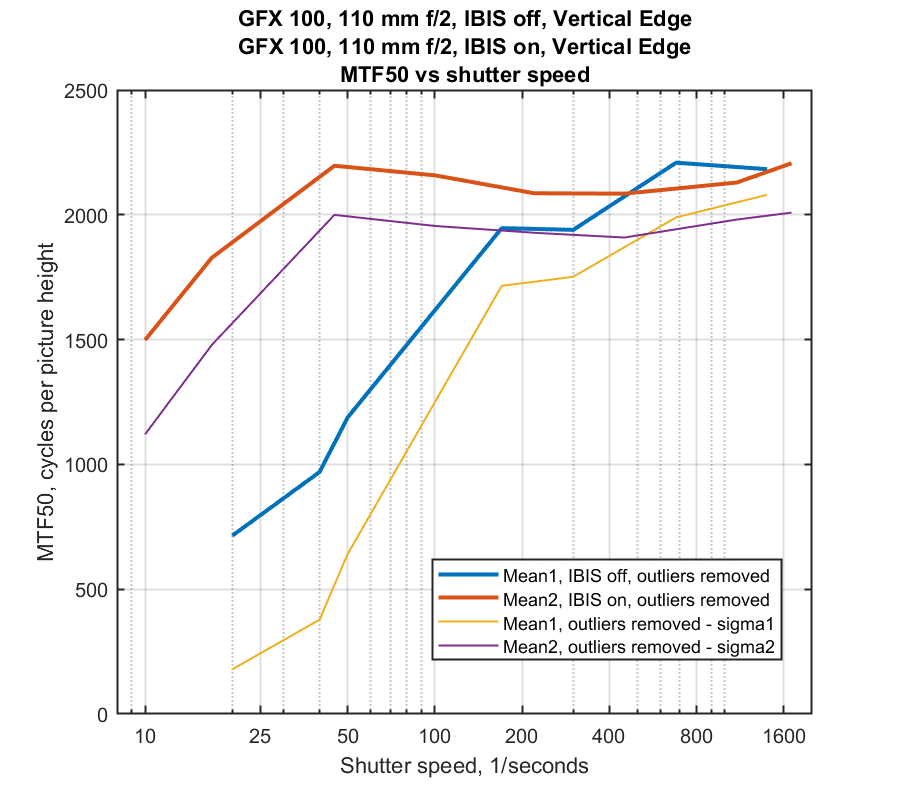
Comparing the IBIS and non-IBIS statistics:
It looks like high shutter speeds are nothing to fear with IBIS on, even if IBIS isn’t doing any good there. It also looks like IBIS is safe down to 1/40 second, or slower than one over half the focal length. I expect that the camera will be even more stable in single shot drive mode, instead of the continuous mode I tested. Standing is about the worst commonly-used shooting position. I will test some more.


Finally, I paid attention to the distribution of “better than average” points “on the left”, where σ is large. Surprisingly, this distribution does not differ much from “a uniform distribution in a certain interval”.
Offhand, I cannot invent a model of shake in which “much better than average” has a comparable probability to “just a bit better than average”. Is there something I miss?!
(Of course, one of possible explanations is that this “equidistribution” is just an optical illusion, and it would disappear when one would try to quantify it…)
The sample space is small for that kind of calculation. I can do some histograms with larger sample sets.
Well, this is a wild goose chase — it is absolutely unclear how this may have happened — but it is also quite unclear whether the answer would have any use…
On the other hand, until one knows the answer — how can we be sure that it cannot be useful? You see: I’m completely lost! 😉
But thanks for the offer anyway — even if you decide not to follow up!