This is the sixth in a series of posts about the Sony alpha 9 Mark II, aka the a9II. The series starts here. You can find other posts in this series by using the category list on the right, and selecting “a9II”.
In the previous post, I averaged 128 ISO 1000 1/1000 second shots, and histogram-equalized the result so any fixed patterns in the read noise would be maximally visible. In this post I’ll do the same with 128 1-second exposures 30 seconds apart. We’ll look first at the overall image in each of the four raw channels.
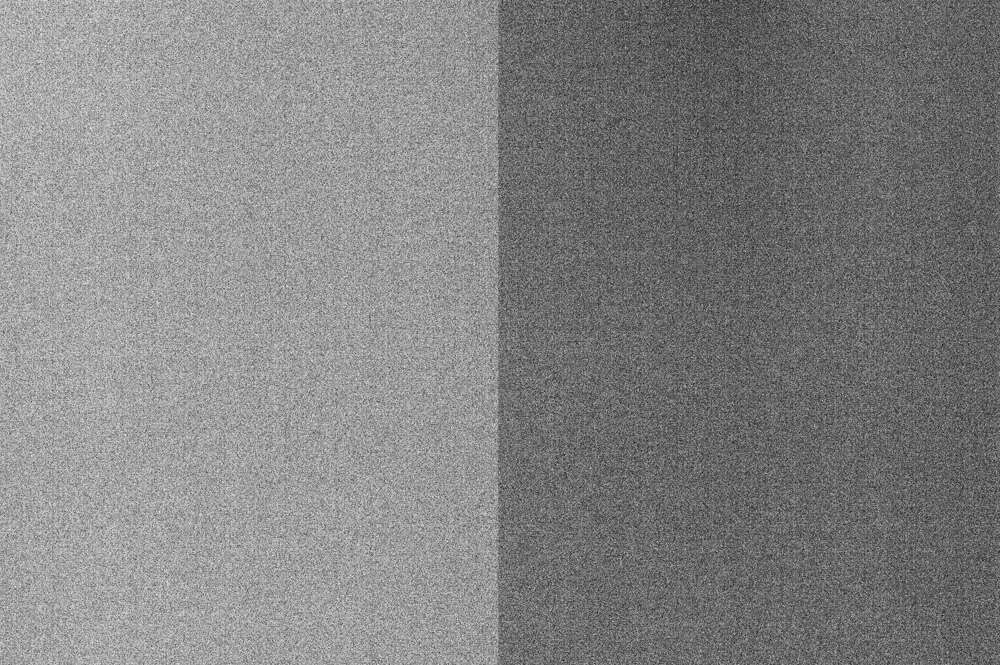



The different noise from the right and left halves of the sensor is obvious in all but the blue channel.
Looking at some tight crops at about 130% magnification:
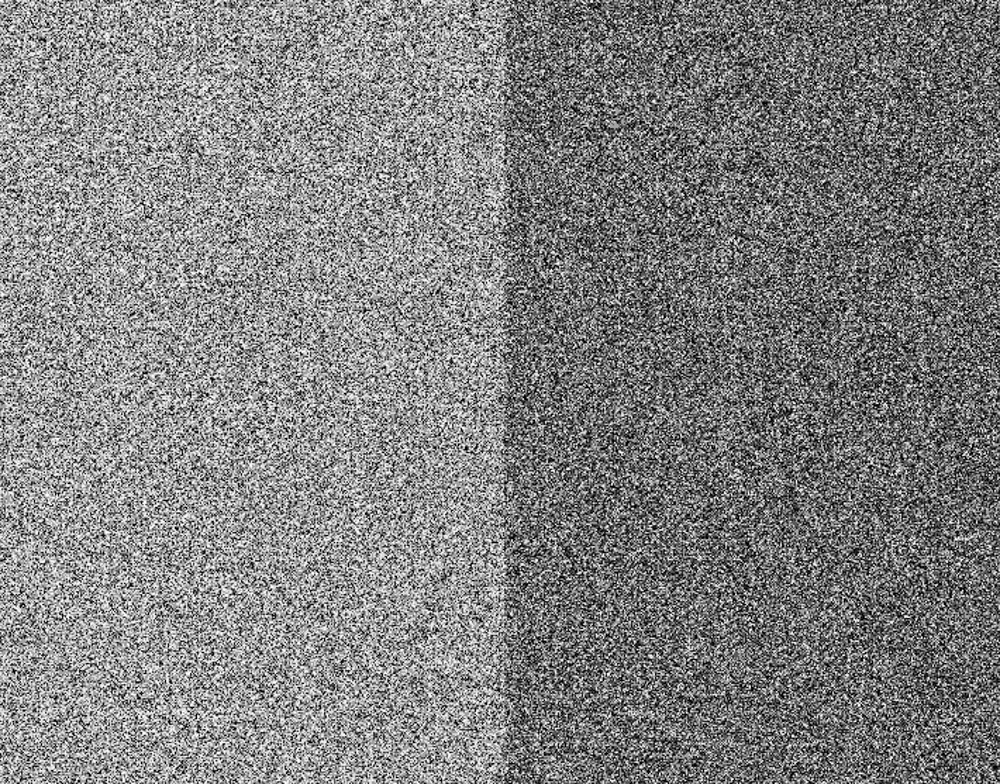
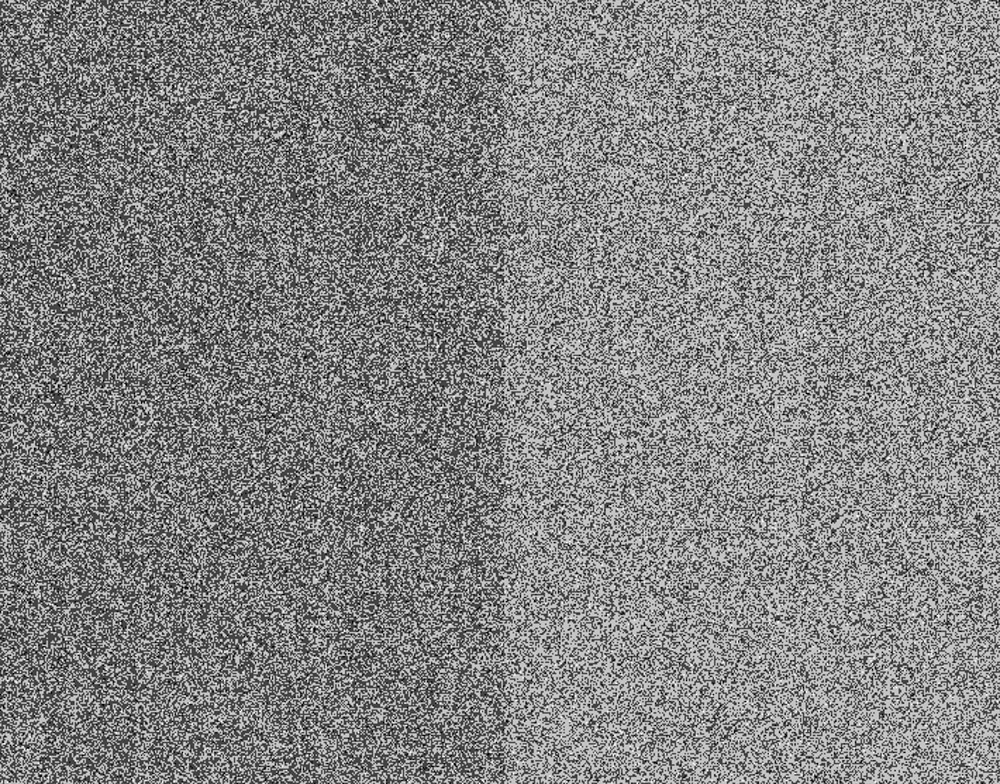
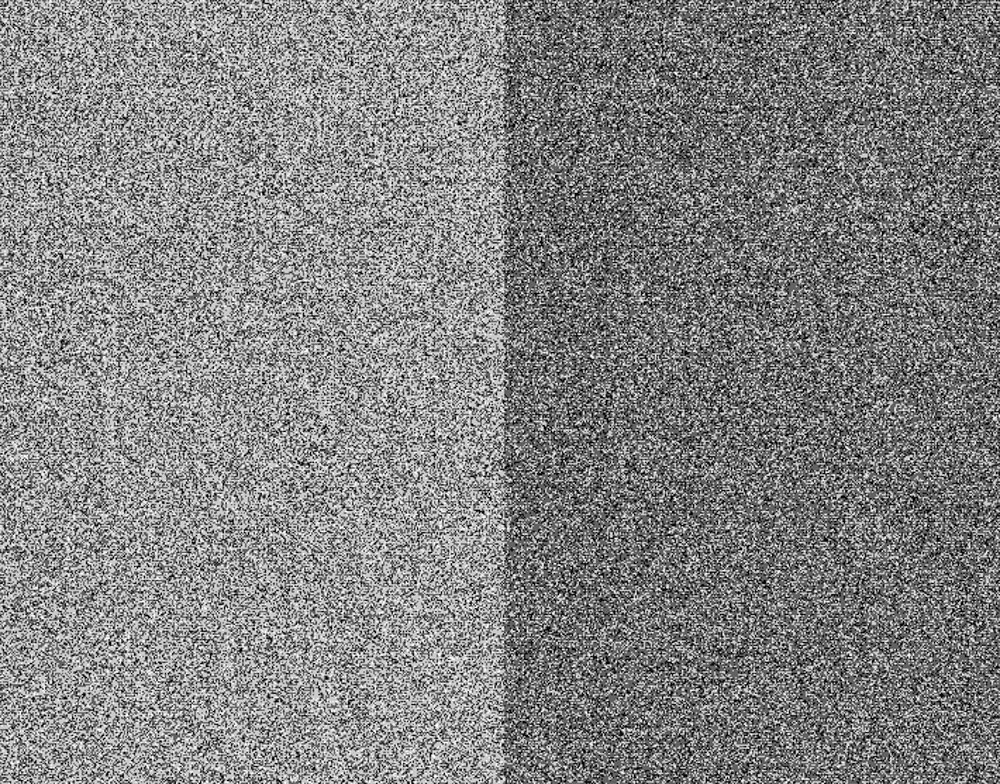
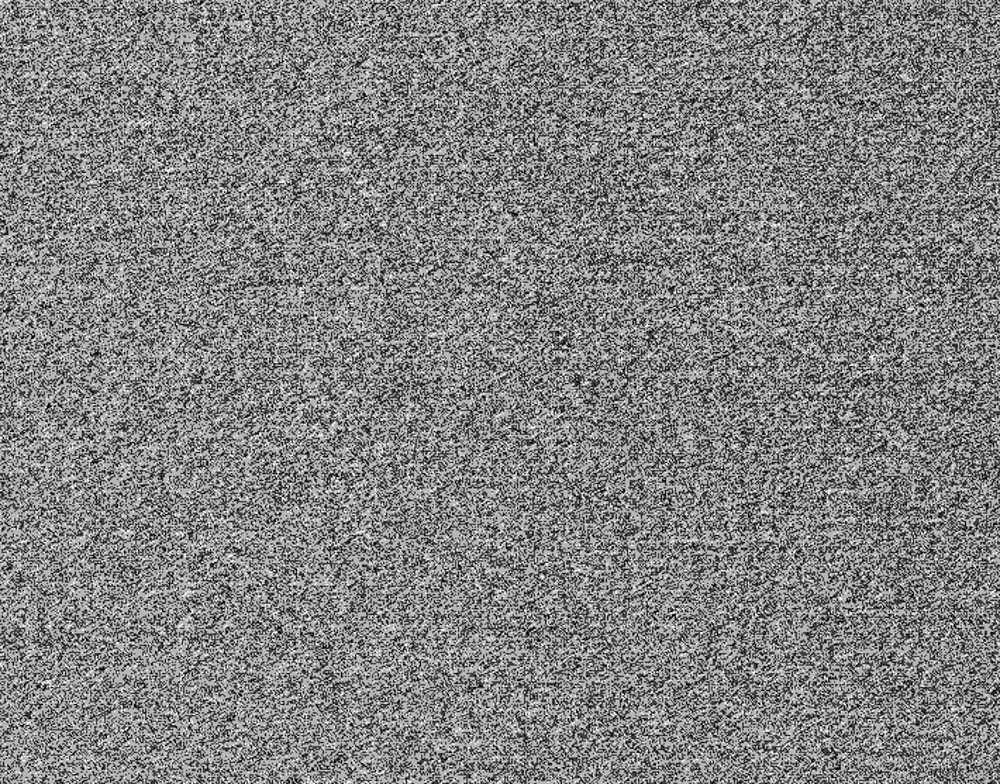
The same fine horizontal stripes that we saw in the previous post are in the blue channel. This is probably related to the PDAF pixels.
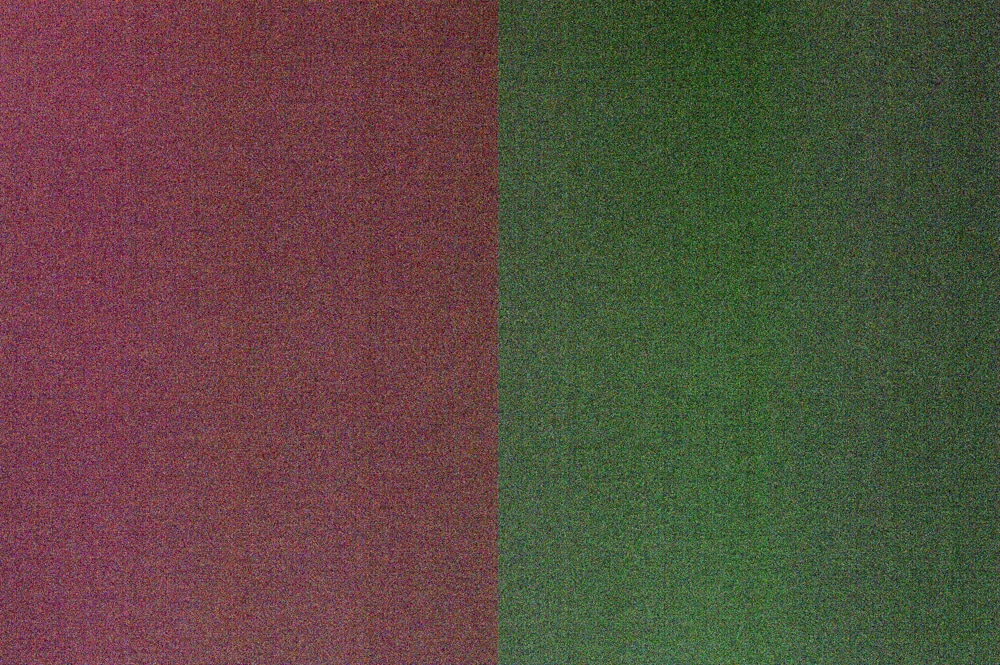
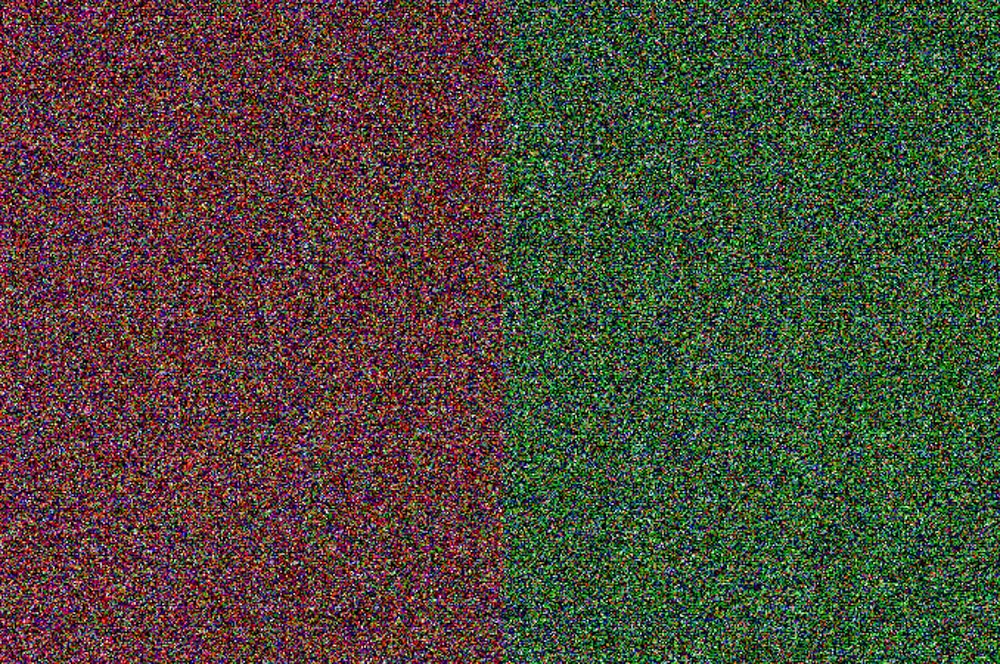
I’m not sure of the utility of this, but here is an exposure-boosted, but unequalized, RGB image with the red, G1, and blue raw channels.
And here’s a crop of that:
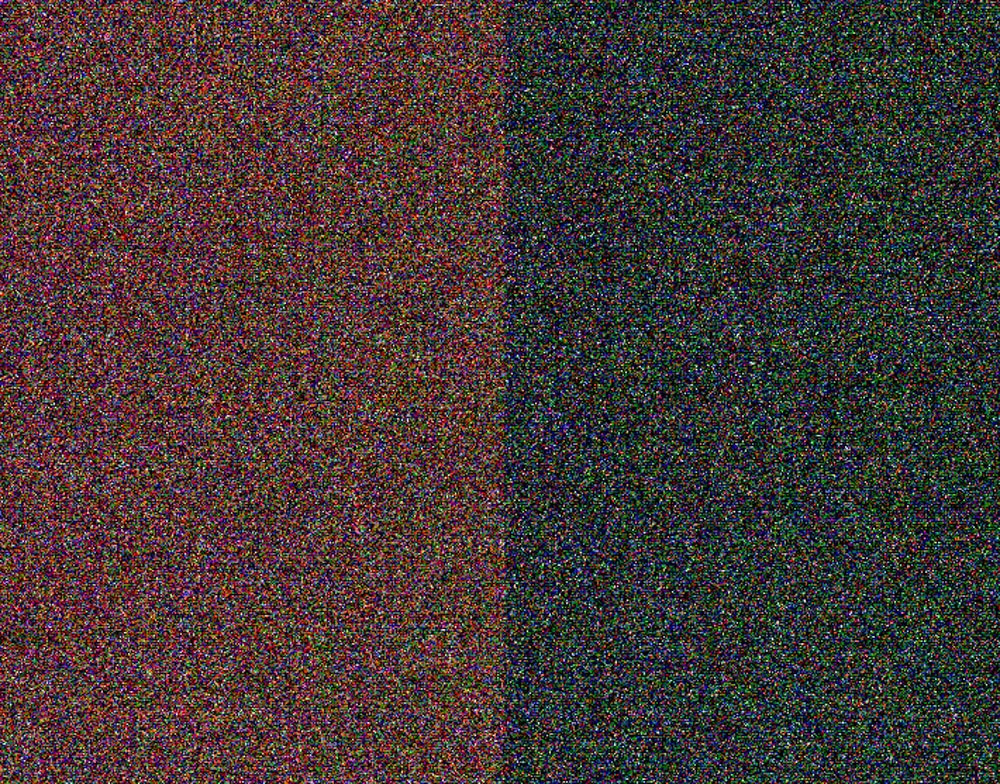
If I average the green channels and blow it up the same amount, I get this:
(You may want to change the post title to the A9 II… ssshhh…)
Oops. Will do.
Jim, since here the separation line is very much more pronounced than in the previous post, can you comment on what happens if you apply the same curve in both settings? (With normalization, the higher visibility may be due to, for example, lower pixel noise…)
That would require that I pass each plane through a compromise matrix, and assume a particular illuminant. As soon as we get several commercial raw developers that can handle the a9II, I’ll run some tests using their conversions to a colorimetric color space.
A lot of thanks! (On the other hand, I was thinking about something way more low-tech — like “increasing contrast” with the same factor in both settings.)