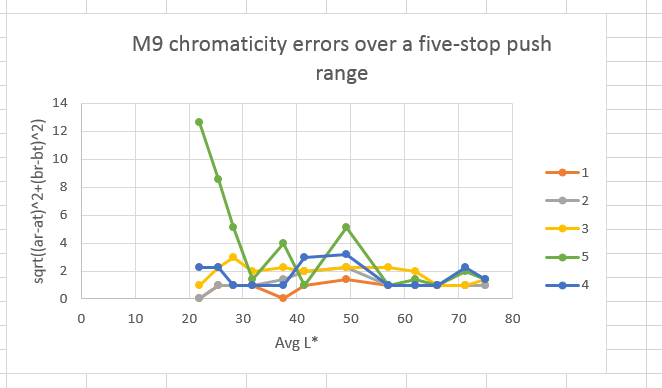
I took the data from the preceding post, and analyzed the chromaticity errors, which I defined at the square root of the sum of the difference between the a* and b* values of the unpushed and the pushed image.
Here’s what I got, plotted, as before, against, the luminance of the test patches:
Except for the error of the two darkest patches with a five-stop push, the errors are small.
Here are the test images, converted to JPEG and the sRGB color space. You are welcome to perform your own analyses. I’ve included the Macbeth chart in case you want to see what happens to the color away from the neutral axis.
No push:
1 stop push:
2 stop push:
3 stop push:
4 stop push:
5 stop push:


Leave a Reply