This is one in a series of posts on the Nikon Z9. You should be able to find all the posts about that camera in the Category List on the right sidebar, below the Articles widget. There’s a drop-down menu there that you can use to get to all the posts in this series; just look for “Z9”.
As usual when I get a new camera, I took a look at the spectrum of the read noise.
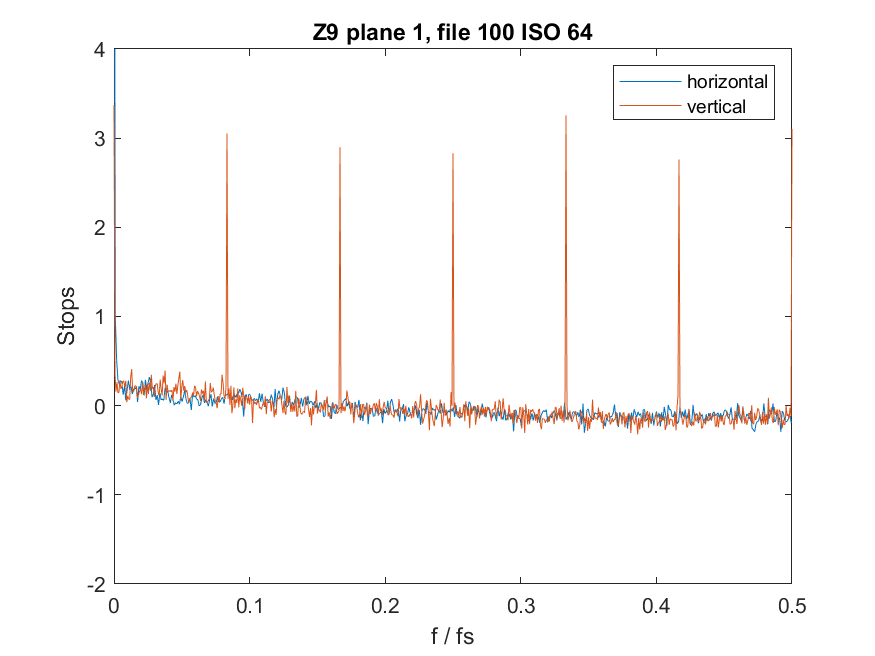
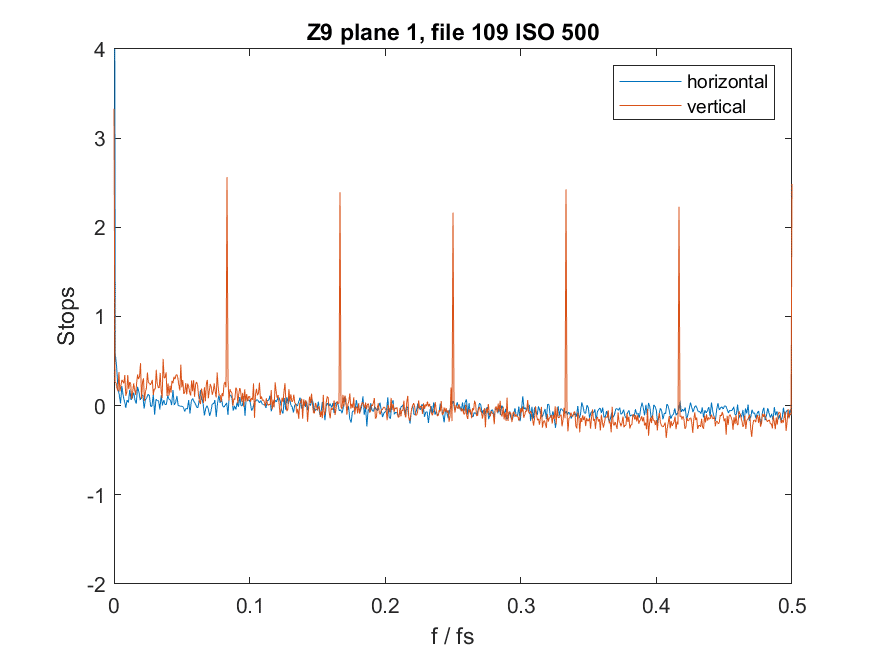
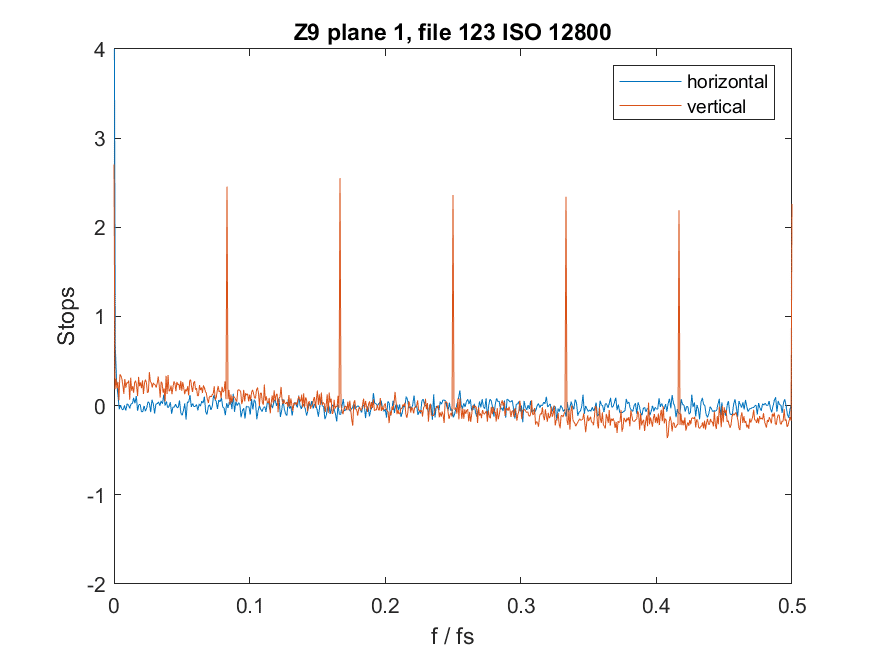
The horizontal axis is the frequency, between 0 and half the sampling frequency (fs). The vertical axis is relative noise intensity in stops. Average horizontal frequency response and average vertical frequency response is plotted. You can see that there are quite intense periodic spikes. I suspect that this is due to the on-sensor PDAF pixels. The period of the spikes appears to be every twelve rows. The above is plotted for raw plane number 1, which is the red plane.
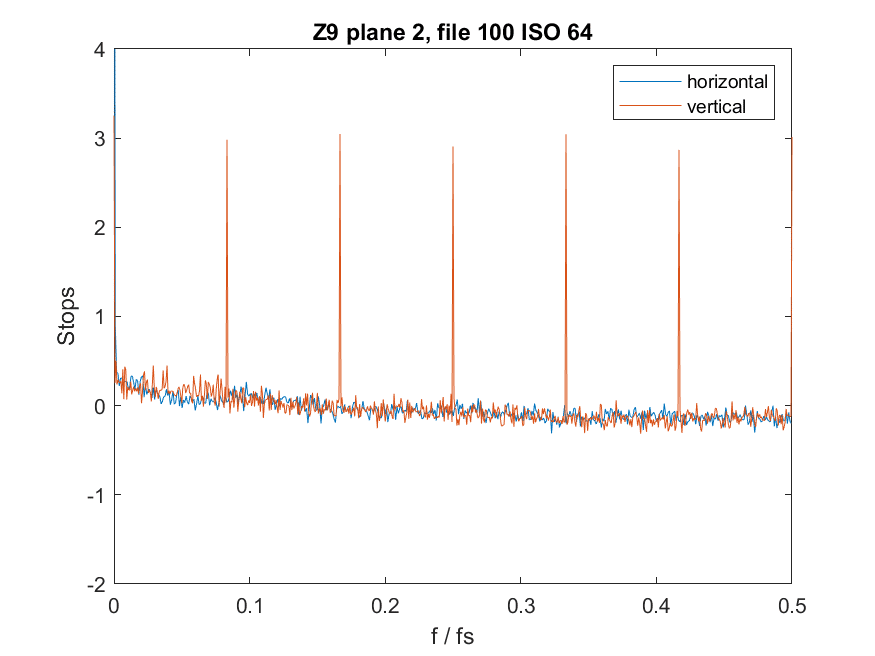
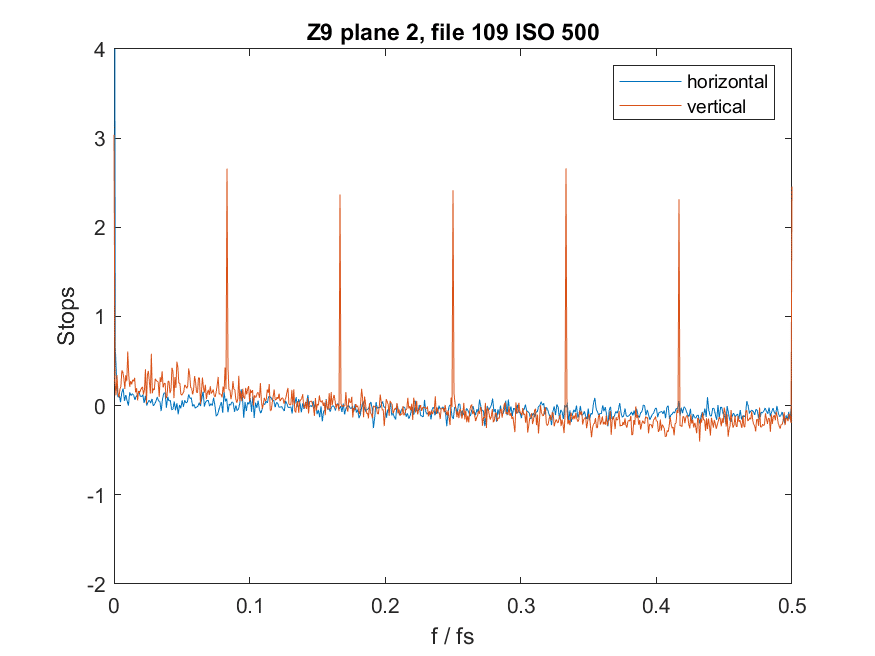
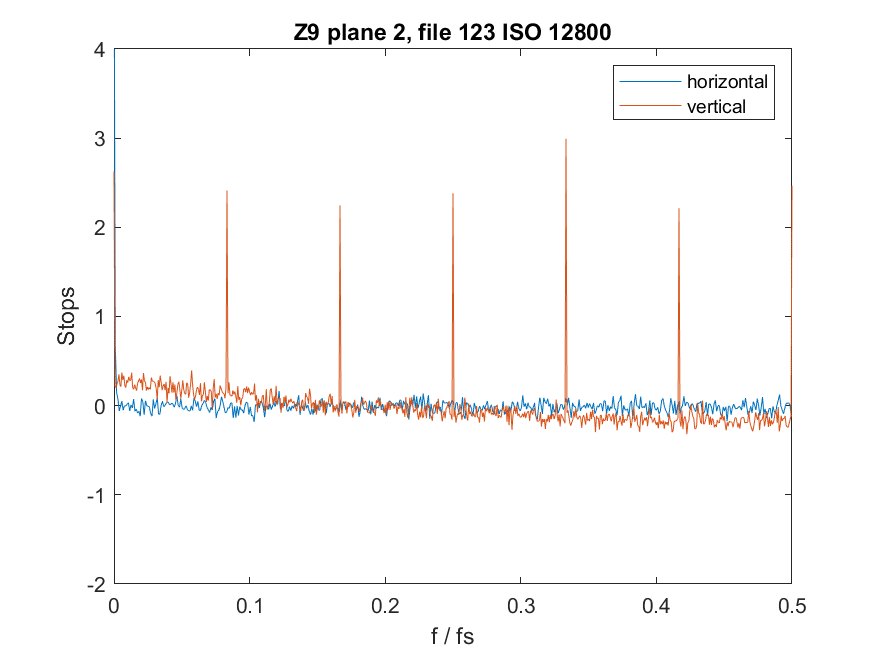
Plane 2 is the first green plane, and looks like the red plane.
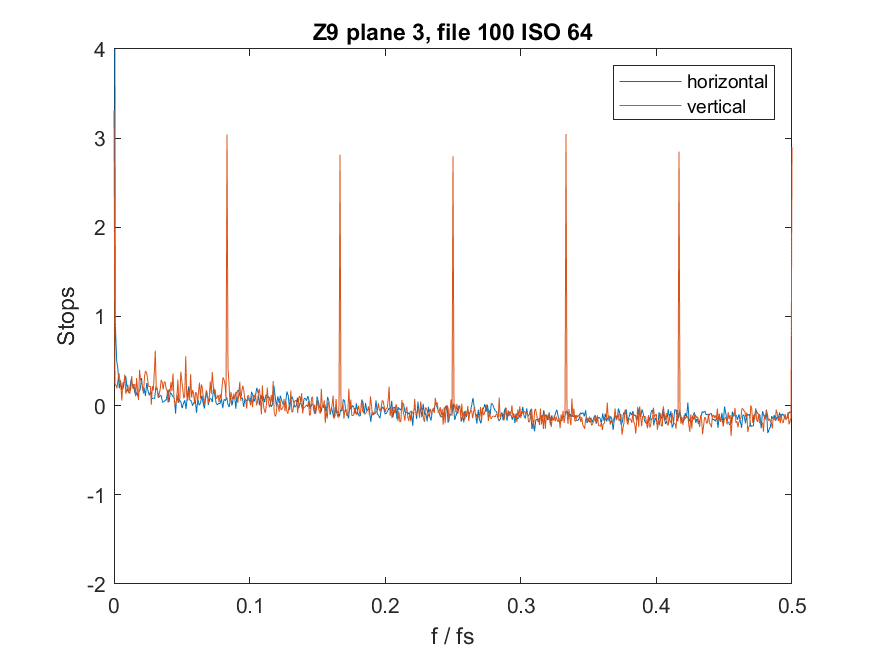
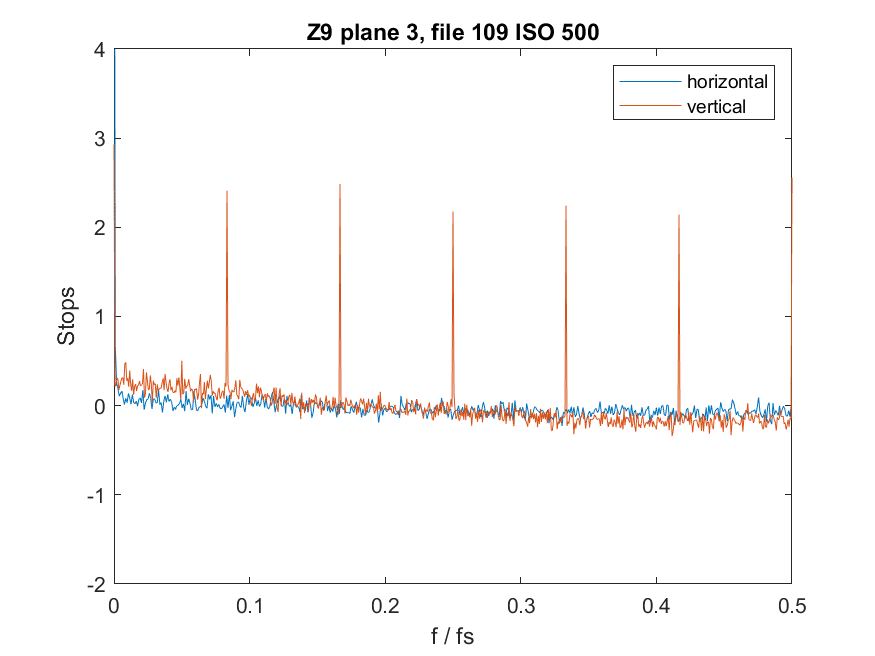
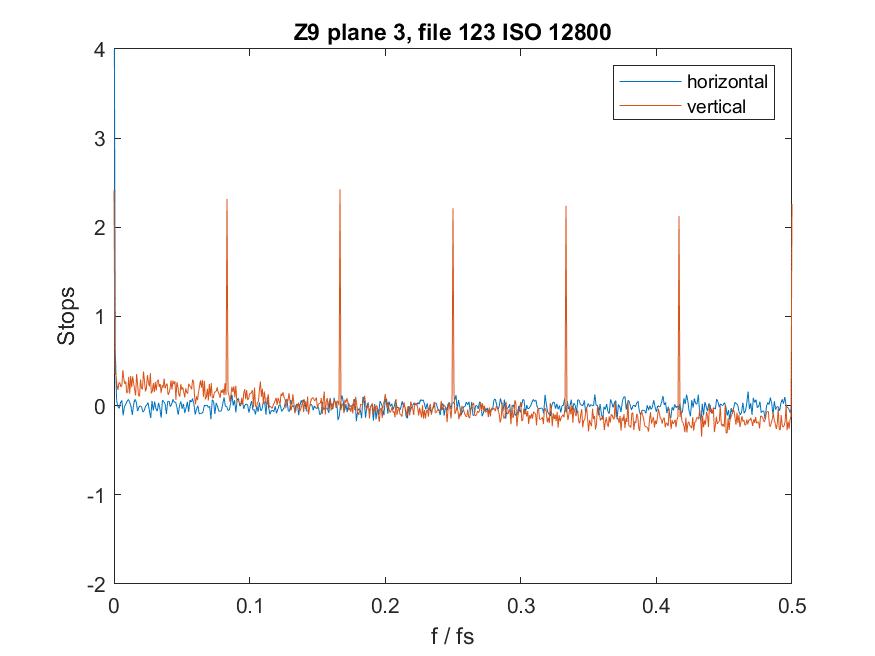
The other green raw plane looks the same.
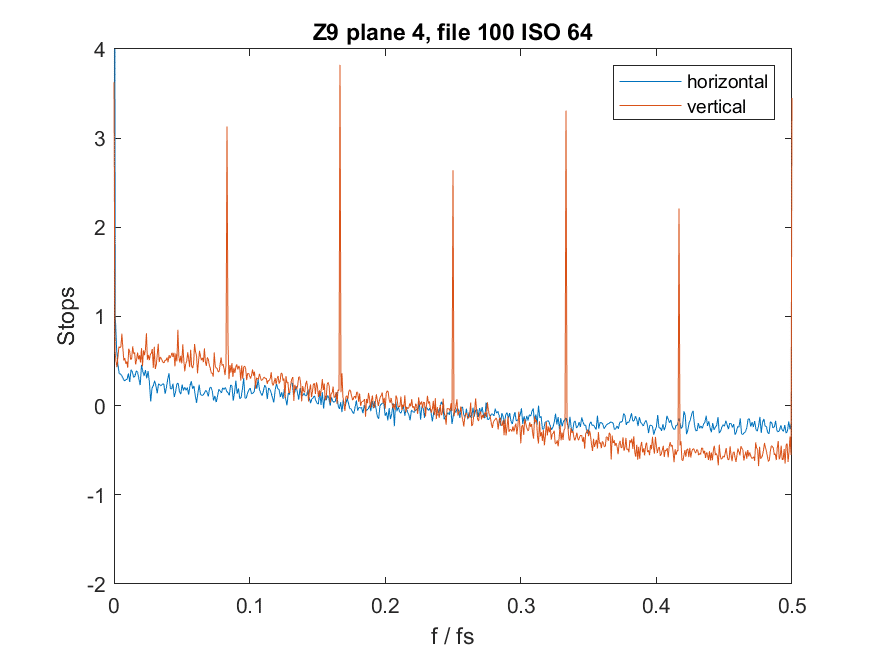
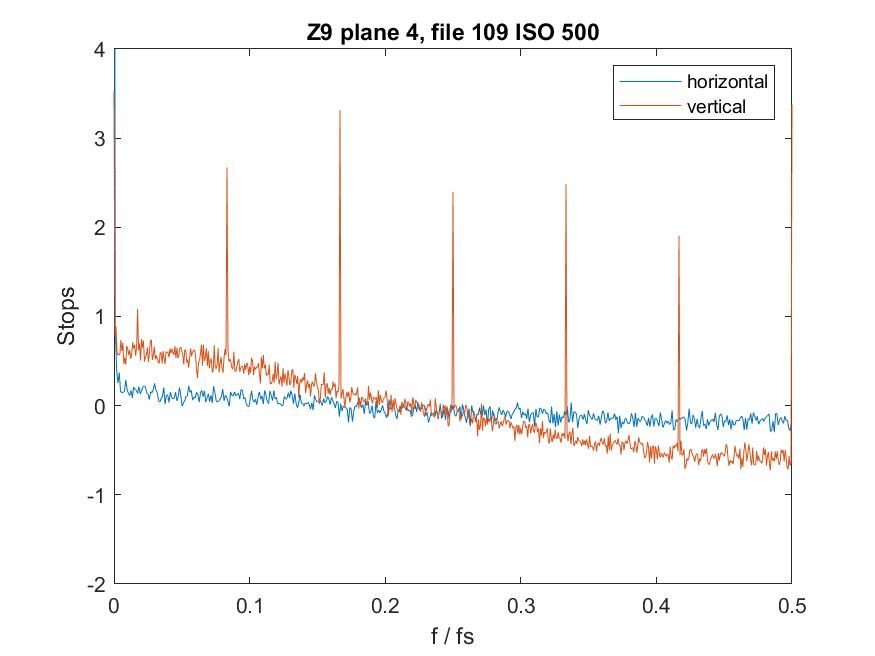
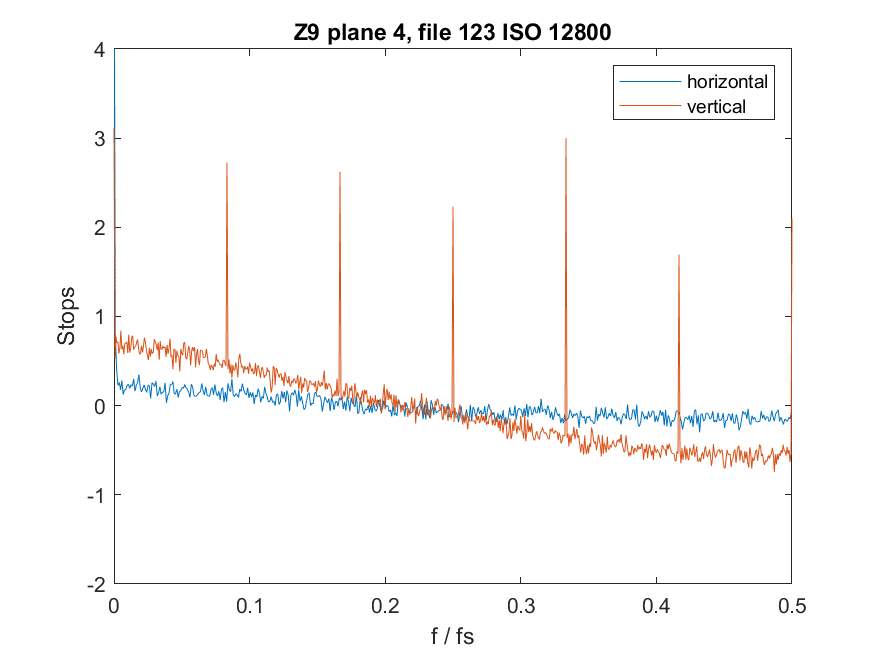
In the blue plane, there is a gradual rolloff in addition to the spikes.
All the spectra look about the same. Here’s a set at the lowest ISO that has high conversion gain.
In most cameras with on-sensor PDAF, the spikes are swamped out at high ISO. Not so with the Z9.
I’ll be checking to see if any of this is visible in actual photographs.
To confirm what is going on you may wish to run plots on just the OSPDAF rows by themselves – and then on all rows except OSPDAF ones. I would assume that OSPDAF rows are noise reduced but the others are not, similarly to the Z7.
Contrary to the Z7, it looks like all color channels get OSPDAF pixels in the Z9.
It seems that there are no vertical OSPDAF pixels.
That’s on my todo list.