This is one in a series of posts on the Nikon Z9. You should be able to find all the posts about that camera in the Category List on the right sidebar, below the Articles widget. There’s a drop-down menu there that you can use to get to all the posts in this series; just look for “Z9”.
Alphabet soup in the post title, huh? I’ll unpack it for you. RN is read noise, which is the image noise that exists independent of the light collected by the sensor. FWC is full well capacity, which is the number of electrons that onoe pixel of the sensor can hold at full scale at base ISO. PDR is photographic dynamic range, which is full scale over the mean signal level that produces a signal to noise ratio (SNR) of 16000 over the image height in pixels.
FWC and RN are of interest mostly only to photo-nerds, but they figure into the calculation of PDR, which is relevant to everyday photography, and to normalized SNR curves, which are a more general way to get an understanding of a camera’s shadow noise characteristics.
We’ll do the nerdy stuff first.
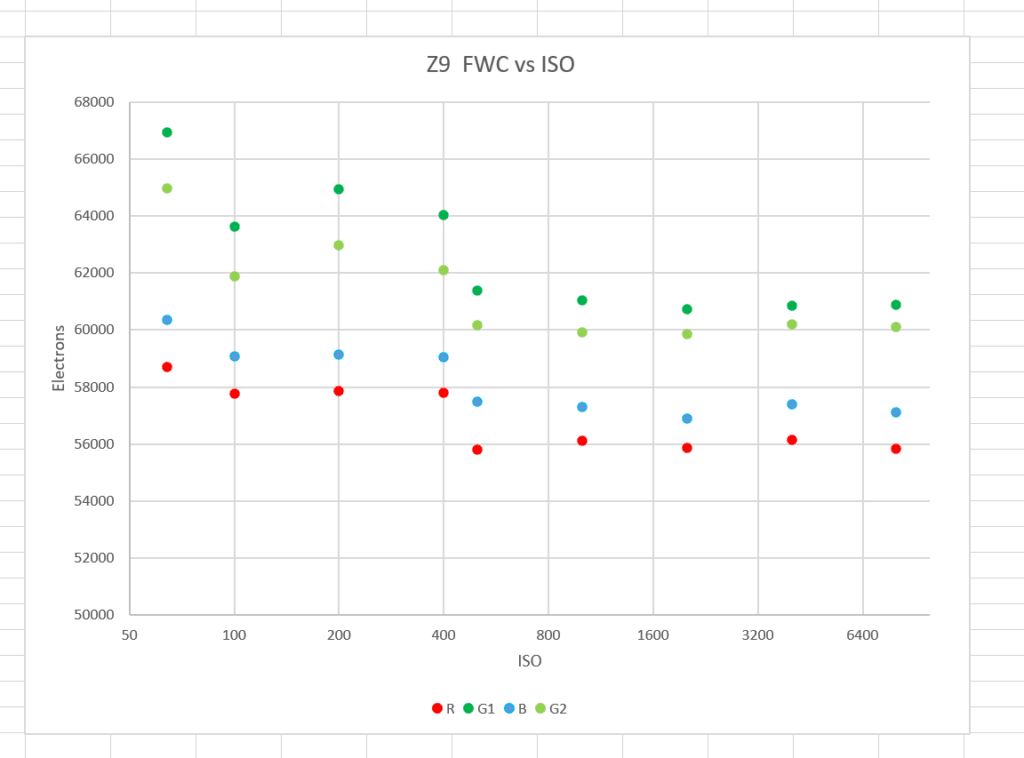
This shows the result of calculating base ISO FWC by looking at images made by the camera at various ISO settings. The FWC of each raw channel is shown. Because of Nikon’s white balance prescaling, the red and blue raw channels measure lower than the two green channels. When I squint my eyes and look at the chart, if seems like the FWC for the camera is about 60,000 electrons. That is quite respectable.
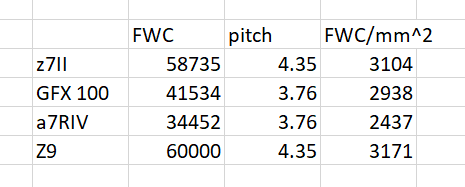
The FWC of the Z9 in terms of electrons per unit area is about the same as the Z7II.
Here’s the read noise:
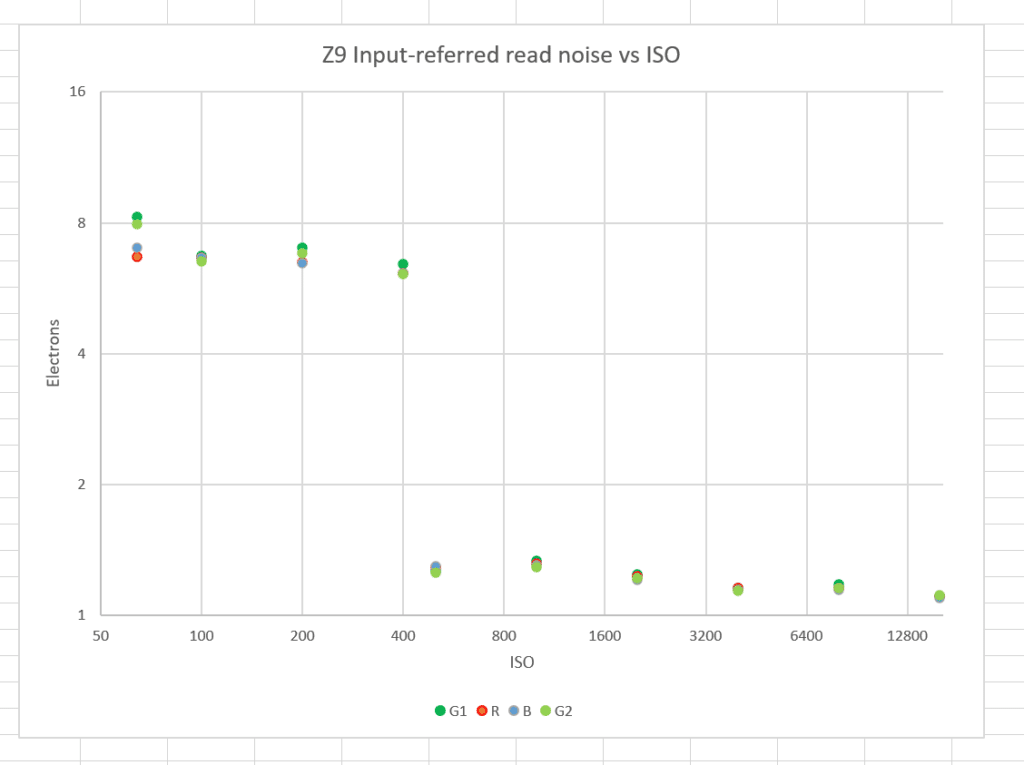
This is input-referred read noise, which calculates the gain in the camera’s signal processing chain, and states the noise in terms of electron count at the pixel. The vertical and horizontal scales are logarithmic. The Z9 is essentially ISOless for ISO 64 through 400, and at ISO 500 through 16000, which is as high as I went with this calculation. The ISO 64 noise is not up to the state of the art for modern sensors, and shows that some sacrifices for the speed of the Z9 stacked sensor design have been made. The RN from ISO 500 on up is right up there with the cameras that have similar pixel pitch.
OK, now the the stuff that matters to working photographers.
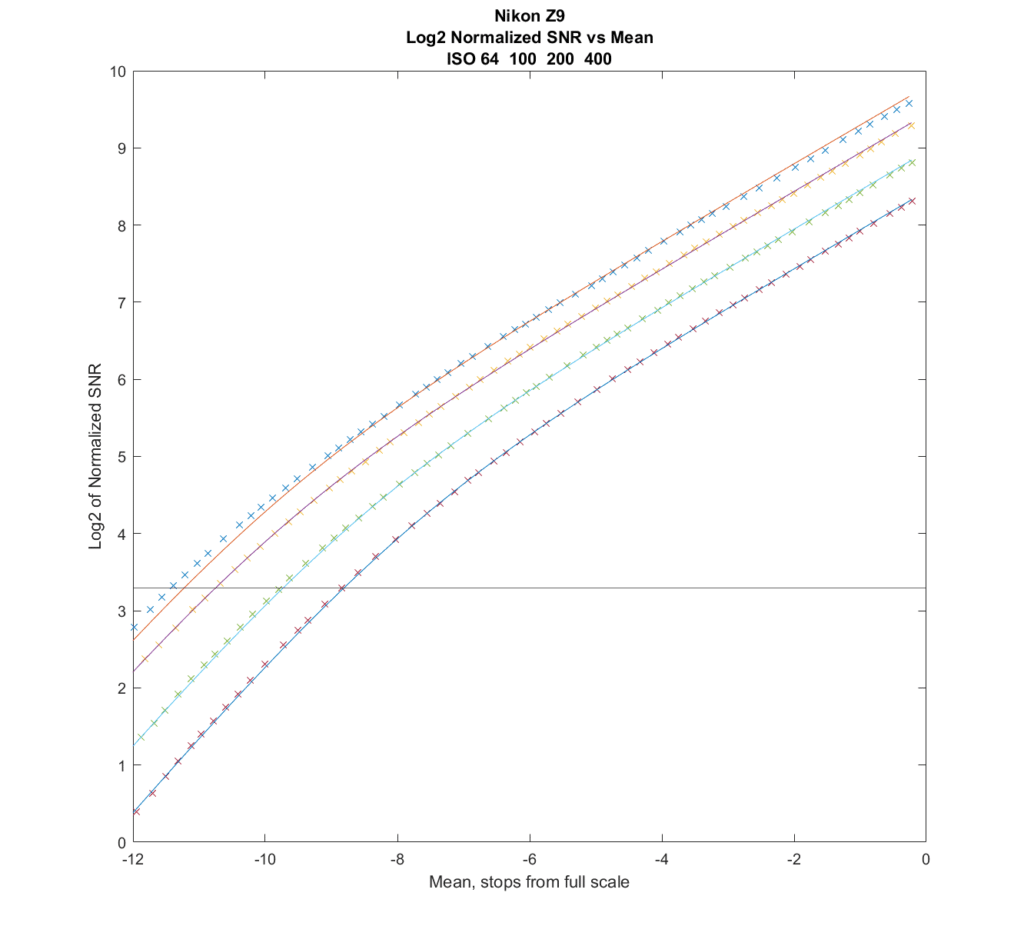
Let’s dissect the above graph. The crosses are measured points. The lines are what a camera model that I fitted to the data says the SNR should be. The horizontal axis is the mean signal level in stops from full scale. The vertical axis is the signal to noise ratio (SNR) normalized to a 1600-pixel-high print. The black line at 3.3 marks Bill Claff’s PDR threshold (log base 2 of 10 is 3.3). The Claff PDR is measured by looking at where each curve crosses the black horizontal line. On the right side of the graph, the most important determinant of the SNR is the full well capacity (FWC) of the camera. On the left, the read noise comes into play. Higher is better. The top curve is for ISO 64, and the curves follow down as the ISO increases.
The PDR at base ISO is a bit less than 11.5 stops. Bill says 11.3, so, as usual, we pretty much agree.
Here are the curves for the high ISOs:
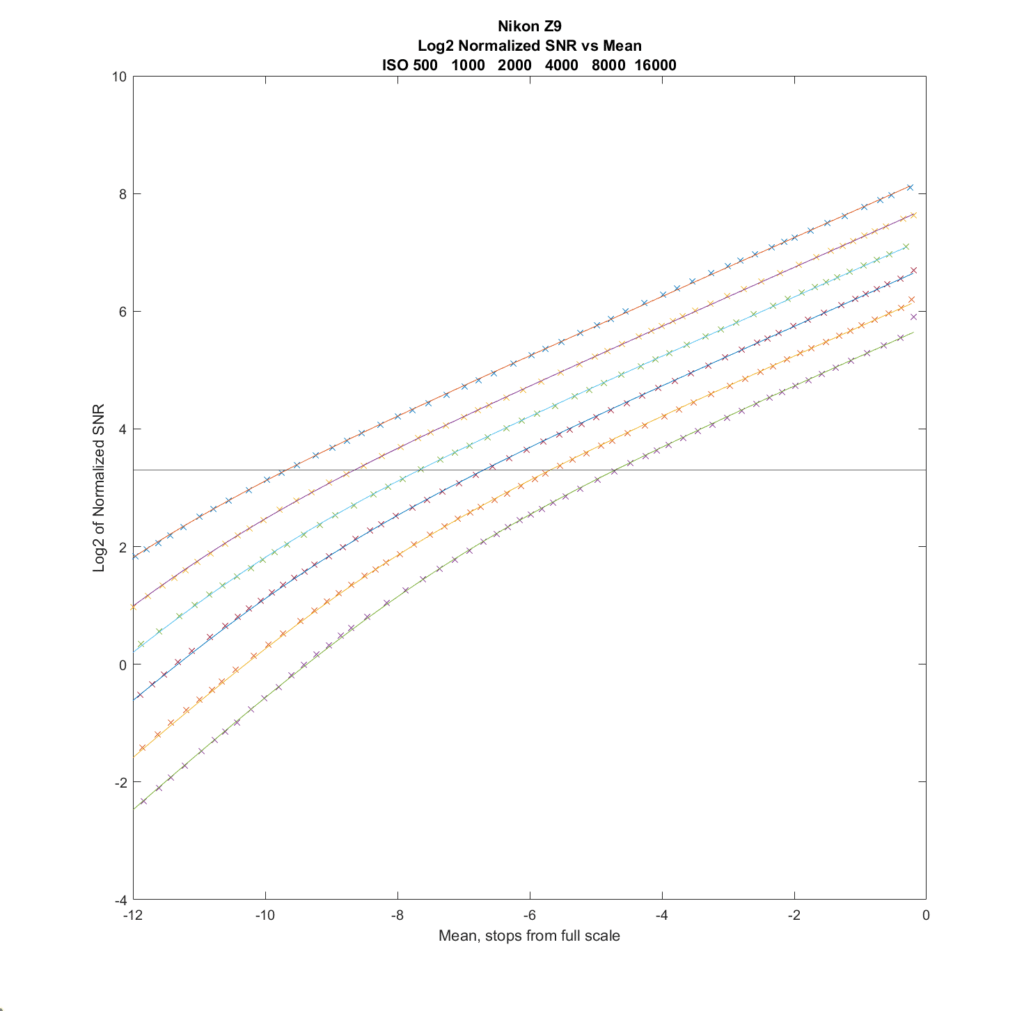
The PDR at ISO 16000 is a bit less than 5 stops. Bill says 4.5 stops.
The Z7 switches from low conversion gain to high conversion gain at the transition from ISO 400 to ISO 500. Let’s look at those two curves.
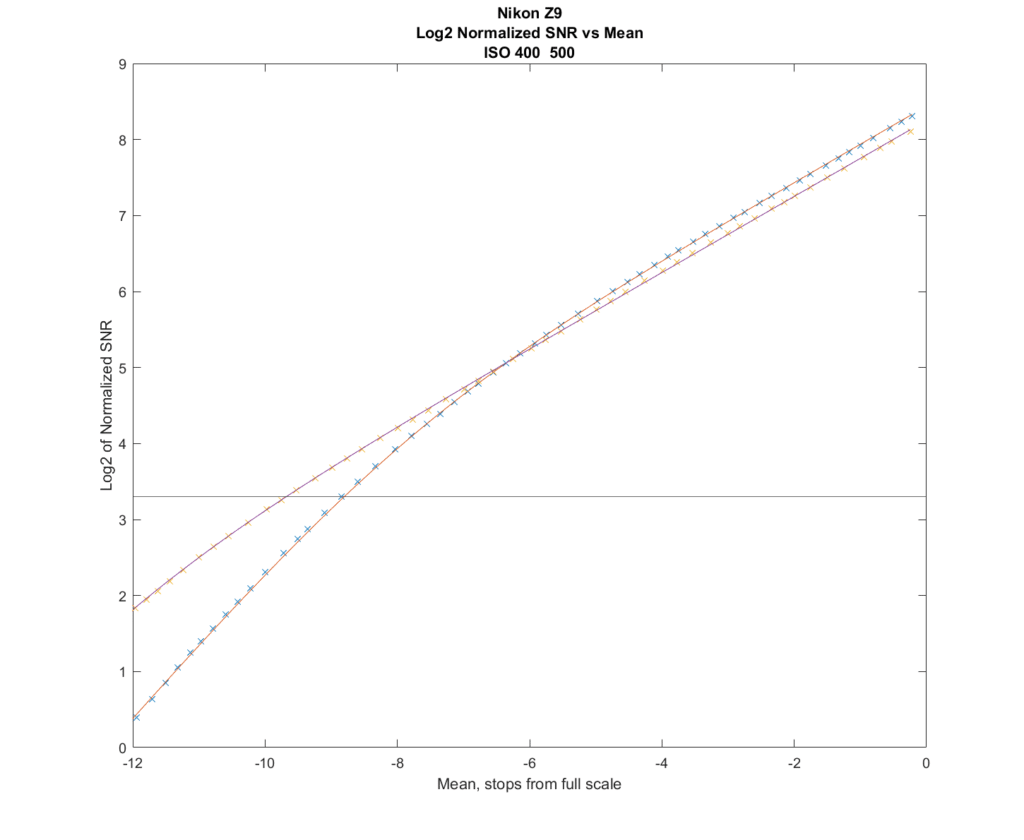
At ISO 400, an ETTR exposure will have a better (higher) SNR than an ETTR exposure at ISO 500 for tones brighter than 6 stops down from full scale, but a worse SNR for tones darker than that. The part of the curves that are bent are the parts where read noise is most significant, and the parts that are straight are the parts where photon noise is most significant. You can see that the read noise affects the ISO 400 curve quite a bit, and that the ISO 500 curve is hardly affect by read noise at all.
Leave a Reply