A DPR PS&T member kindly supplied me with a collection of reflectance spectra about 220 natural objects. I added that set to my other patch sets, and performed a principal component analysis (PCA) on each set. One thing I did differently this time is I restricted the wavelengths under consideration to the set between 400 and 700 nm, inclusive. That provided a more level playing field, since I had values in that range for all the sets.
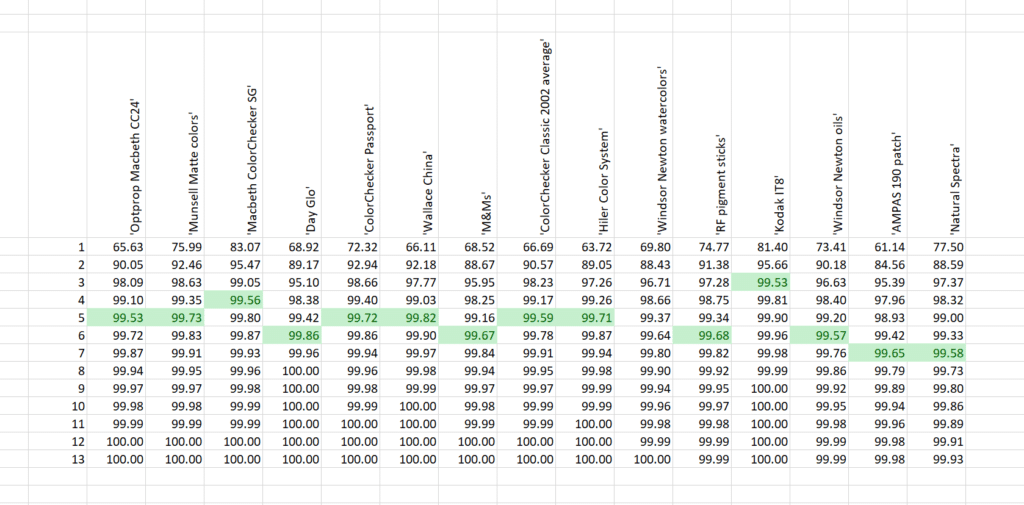
The top row contains descriptors of the patch sets. The first column is the number of eigenvectors used in the reconstruction. The rest of the readings are the cumulative “explained” metric of PCA, which, for n in column 1, is the percentage of the total variance explained by the eigenvectors from 1 through n. I’ve flagged the first place in each column where the score is above 99.5%.
The set with the lowest dimensionality is the Kodak IT8 set. That makes sense, since that set was created from one set of three film dyes. The patch set with the highest dimensionality is the AMPAS 190-patch set, but the natural spectra set has slightly higher dimensionality.
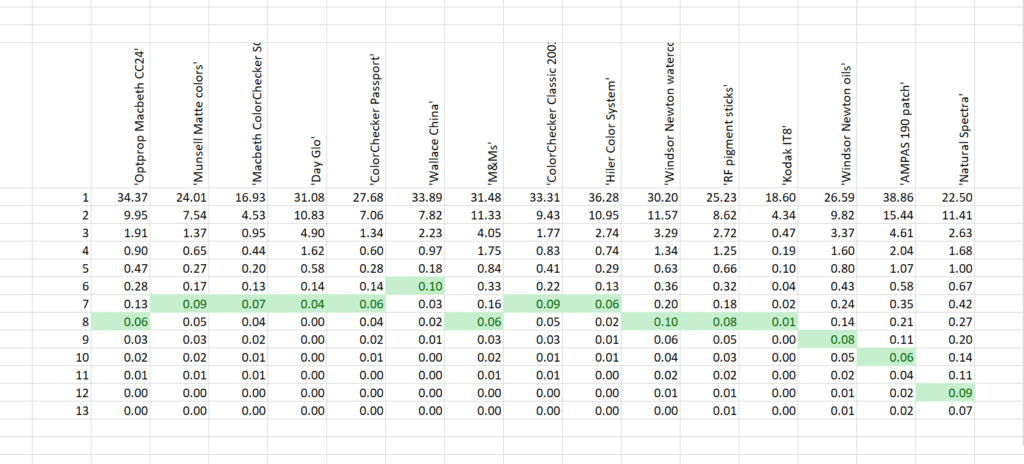
Another way to look at it is to subtract the “explained” field from 100, to give a metric of residual error:
I’ve identified in green the number of eigenvectors it took to drop the residual error to 0.1 or less.
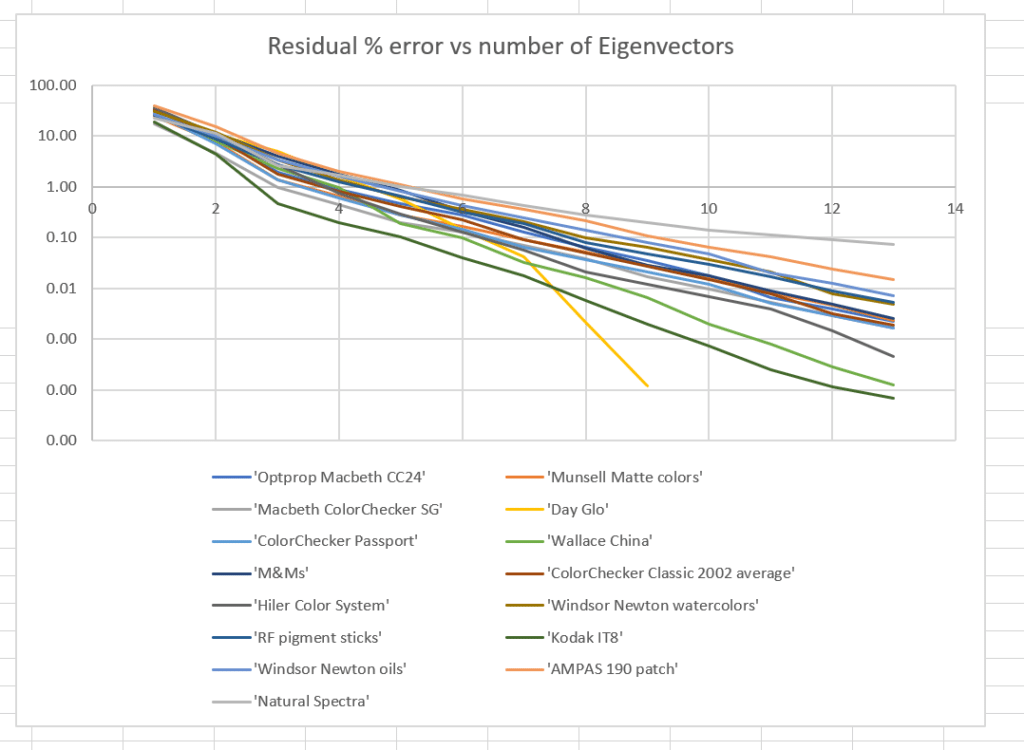
Graphically:
It looks like 12 eigenvectors is enough for this set of real world reflectance spectra, which is heavily biased towards botanical objects.


Leave a Reply