This is the seventh post in a series about the Leica Q2 Monochrom. You can see all the other posts in the series by looking in the Category List drop-down menu on the right side of the page.
In a previous post, I show you some anomalies in the Leica Q2 Monochrom dark-field histograms. Such things are sometime indicative of raw data manipulation that can be observed in the spatial domain. Wanting to take a look, I modified my sensor spectral analysis program to work with monochromaic files, and looked at the dark-field ISO series.
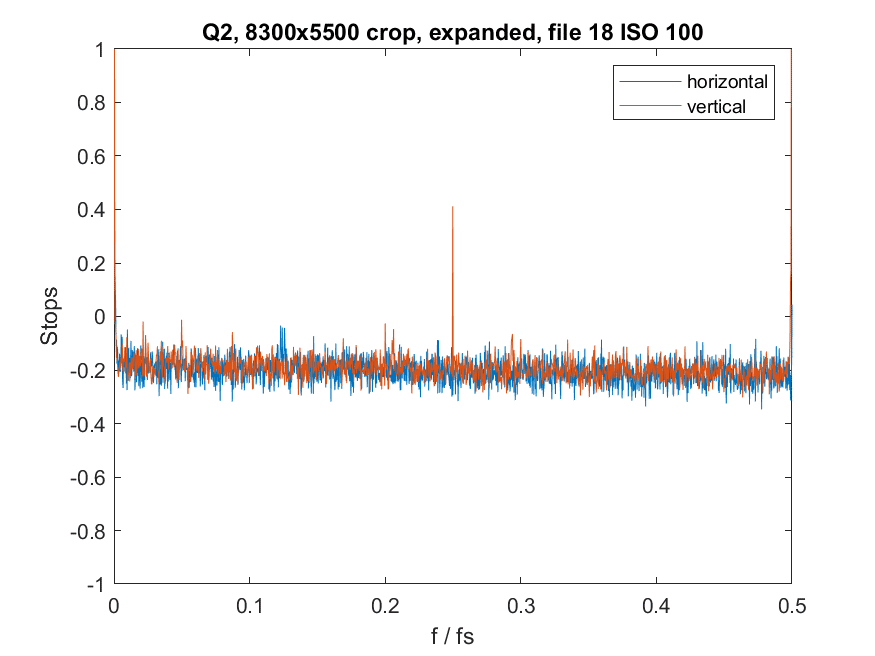
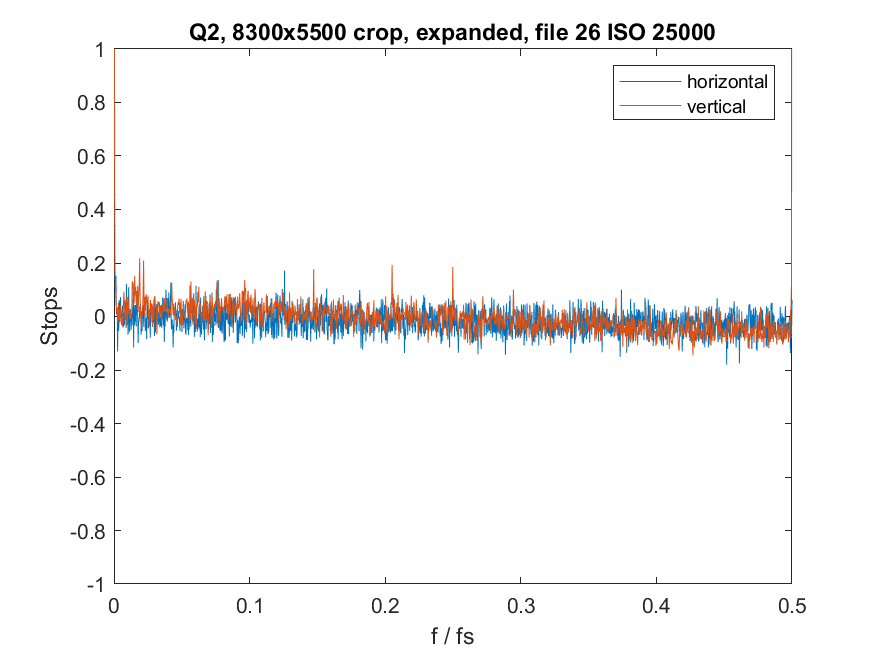
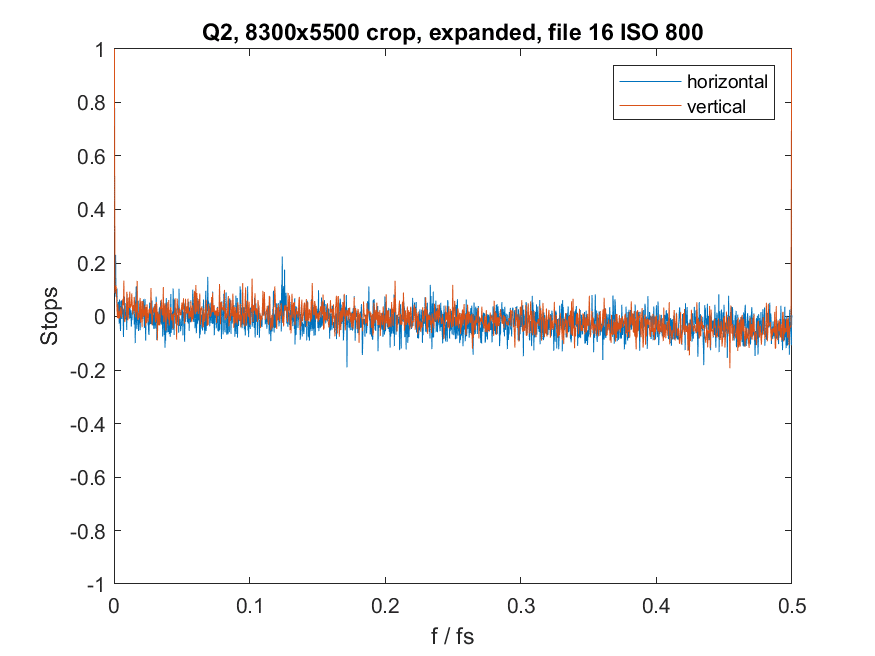
The data is from a crop of the full image. The crop dimensions are 8300 by 5500 pixels. Analyzing the whole frame produces strange results that I’ll talk about at the end of this post. The horizontal axis is frequency normalized to the sampling frequency of the sensor. 0.5 is the Nyquist frequency. The noise is expected; after all, we’re analyzing the spectrum of noise. The spike at one-quarter of the sampling frequency in the vertical direction is an indication of some systematic errors, but it is small enough to not be something to worry about. This is good performance.
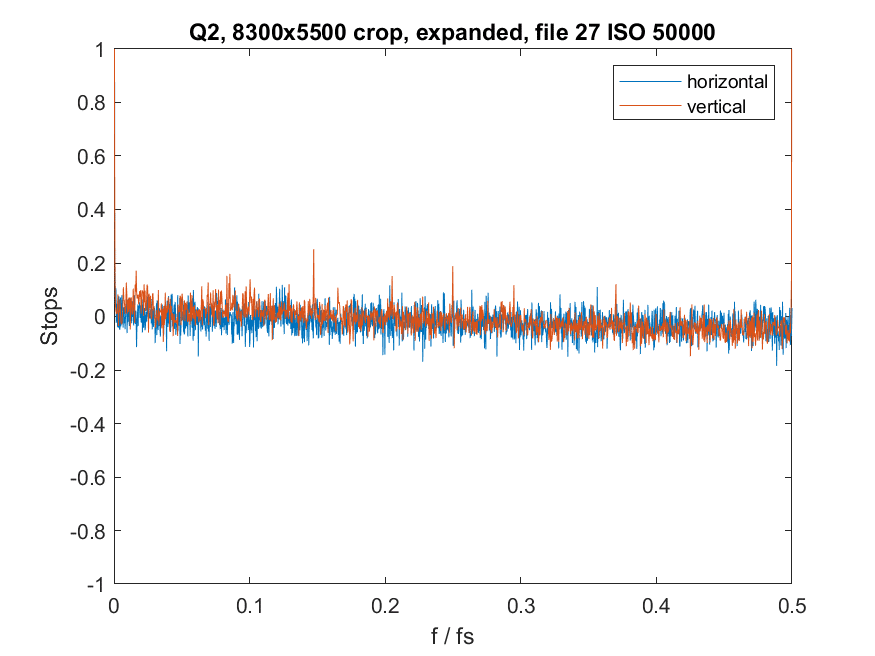
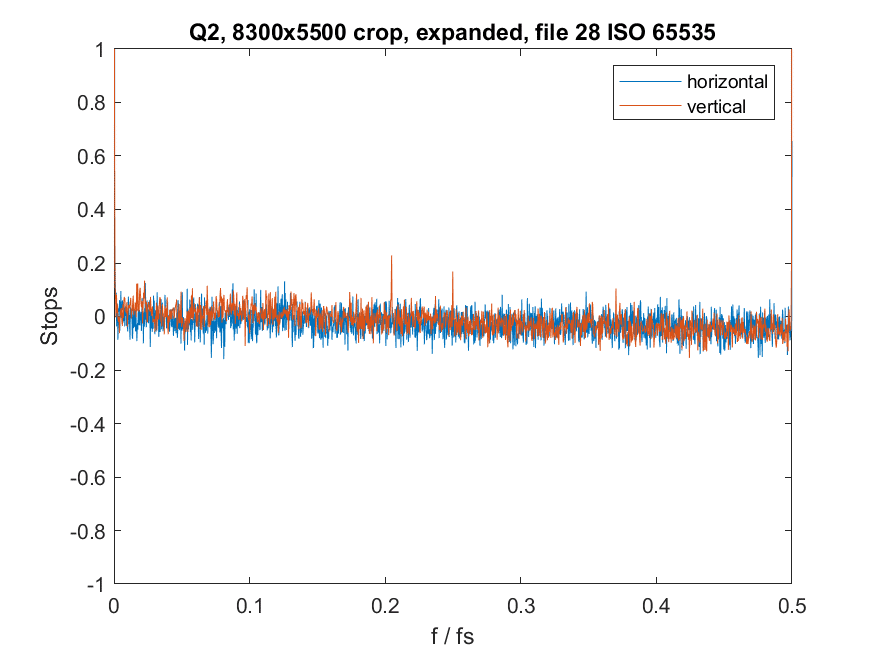
The rest of the ISOs look similar, with the spike at 1/4 the sampling frequency getting smaller as the read noise swamps it out.
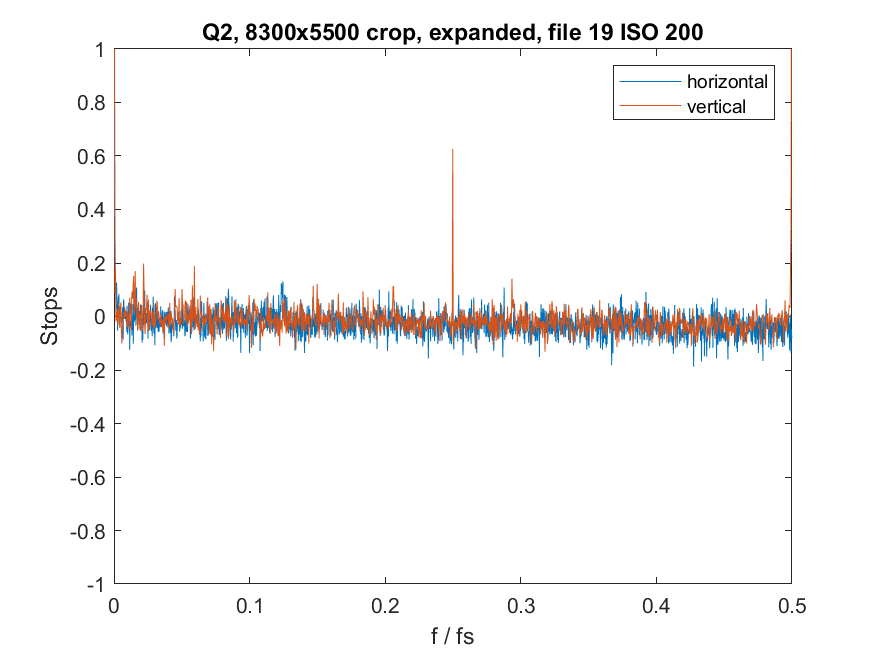
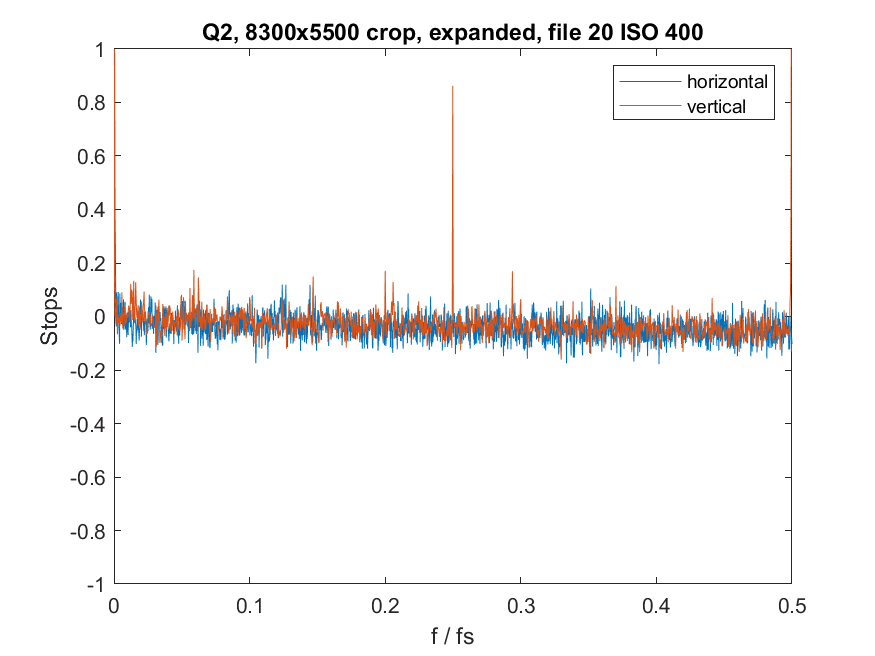
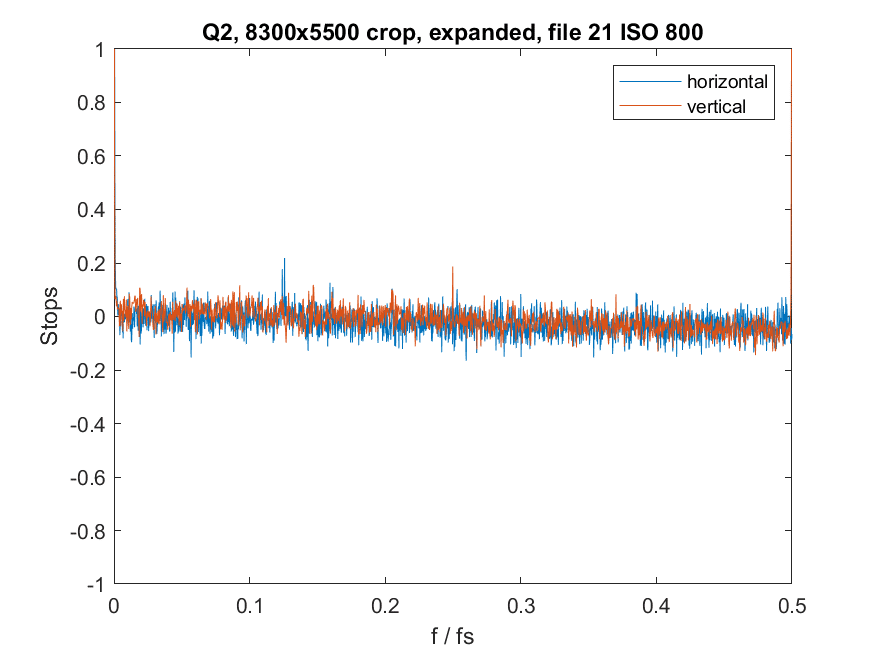
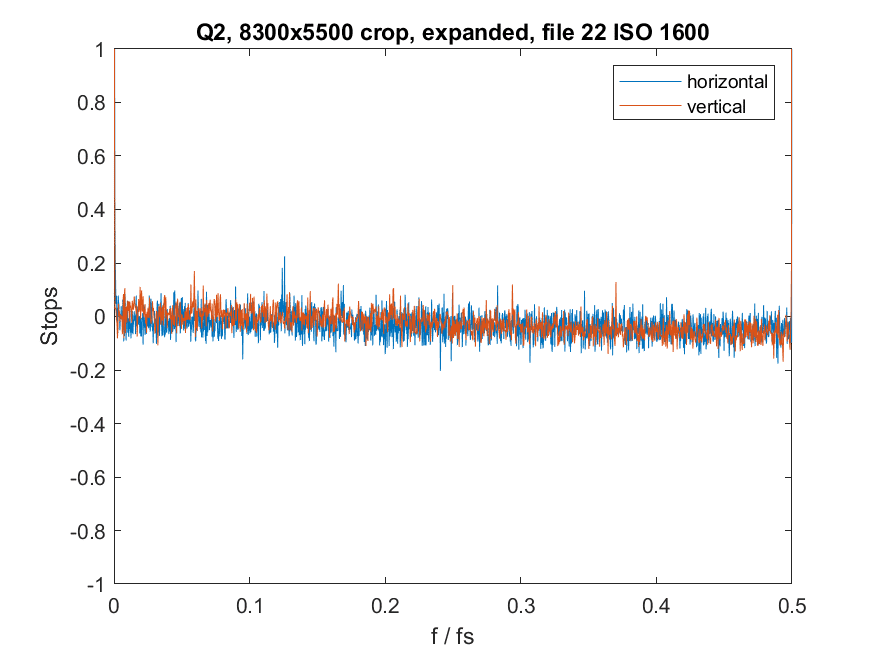
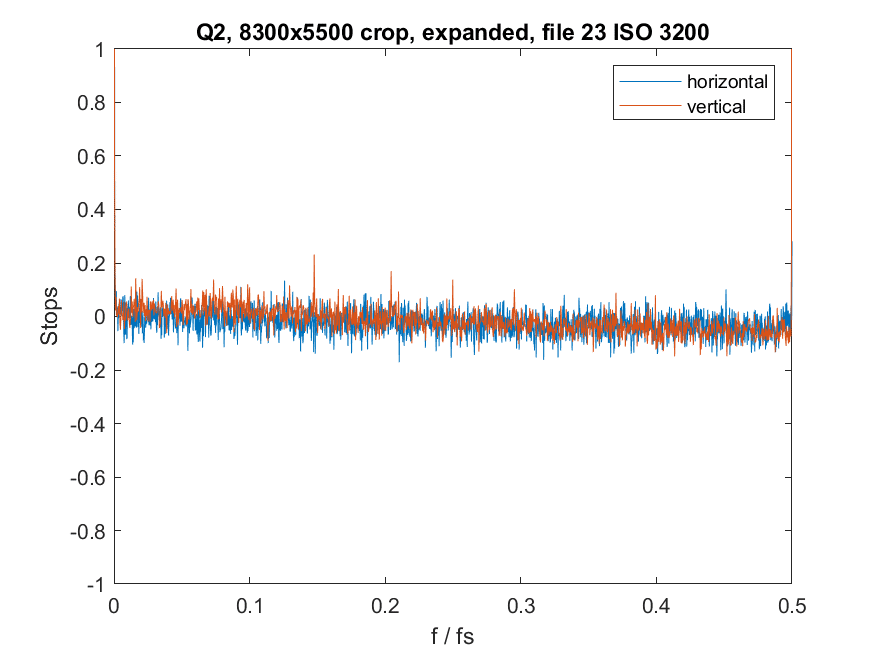
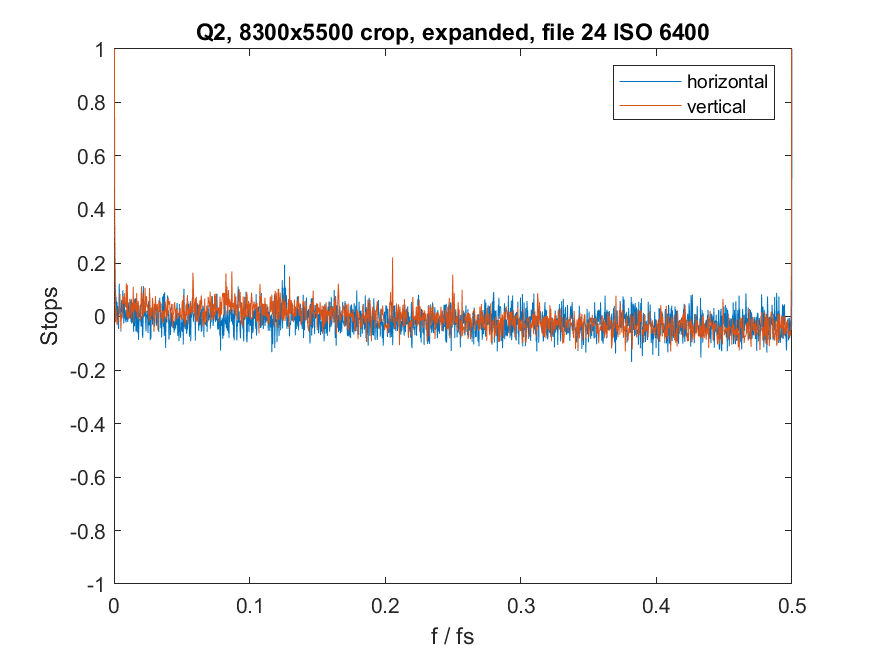
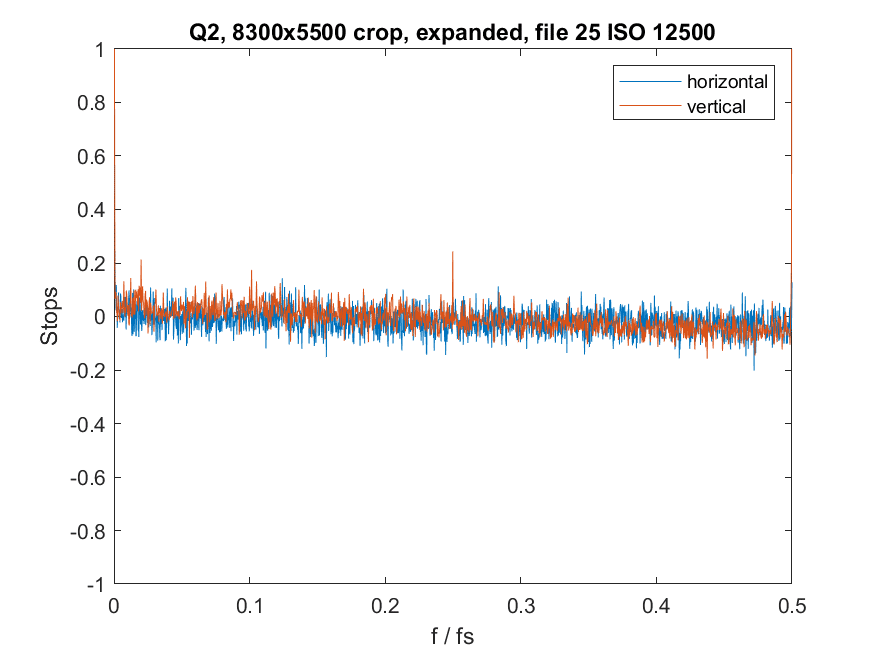
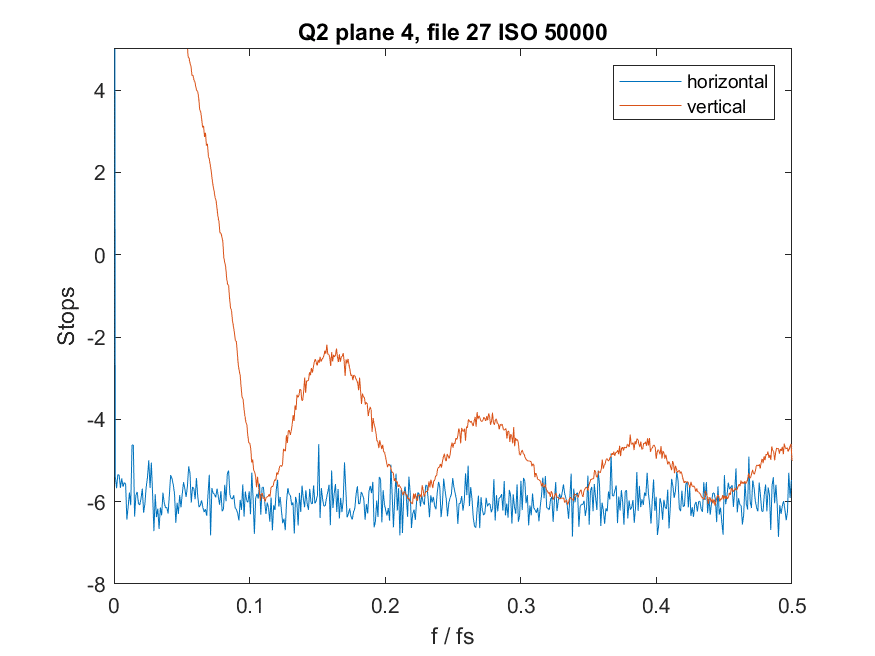
Here’s a sample with no crop:
There’s something going on that is causing the periodicity in the vertical direction. I’ll be looking into that. If may be information that is written into the file by the camera, but that is not part of the intended image area.
I set the ISO to 800 and looked at the dark-field spectra with shutter speeds from 1/2000 through 1 second. They all looked fine. Here’s a sample at 1 second:

Leave a Reply