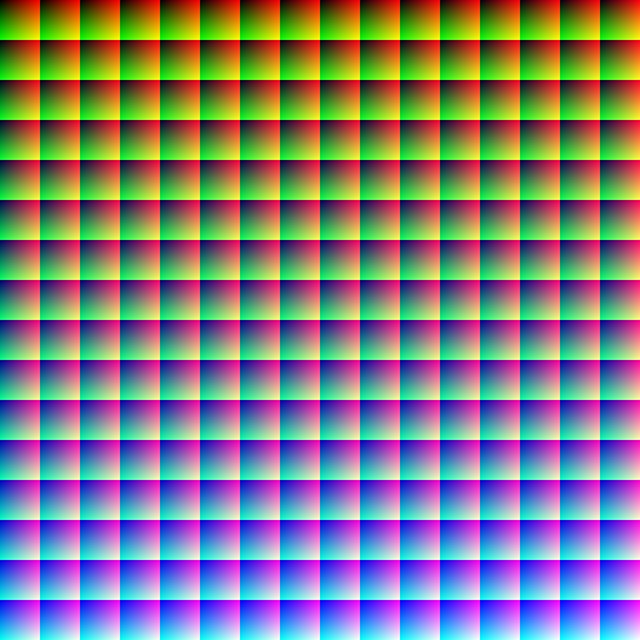
Bruce Lindbloom has another test image on his website: a 16 megapixel image containing all possible RGB colors in an 8-bit per plane RGB space. The image is arranged with the colors in a regular order, so you can see where particular colors of interest are:
I brought the image into Photoshop and changes the mode to 16-bit color. That did not give me the entire RGB gamut, since the 8 least significant bits of the values that had been 255 were assigned 0’s instead of 1’s, but it was close enough. I could have tweaked the image in Matlab to have it use the entire gamut, but I was afraid that I would inadvertently stumble into an implantation issue in Ps’s 16-bit image processing.
I assigned a sRGB profile to the newly 16-bit image in Ps, and saved it. Then I converted it to Adobe (1998) RGB with dither off, black compensation off, and a rendering intent of absolute colorimetric.
I brought both images into Matlab, converted them to Lab with a D65 white point using the 2 degree observer, and computed the pixel-by-pixel DeltaE. I got an average error of 0.0217, a standard deviation of 0.0552, and a worst-case error of 1.2394.
It is interesting that the worst case error for this image in substantially less than for the synthetic image of Bruce Lindbloom’s desk. For the moment, my working hypothesis on that is that is has to do with my 16-bit, 16 million color image not using quite the entire sRGB gamut.
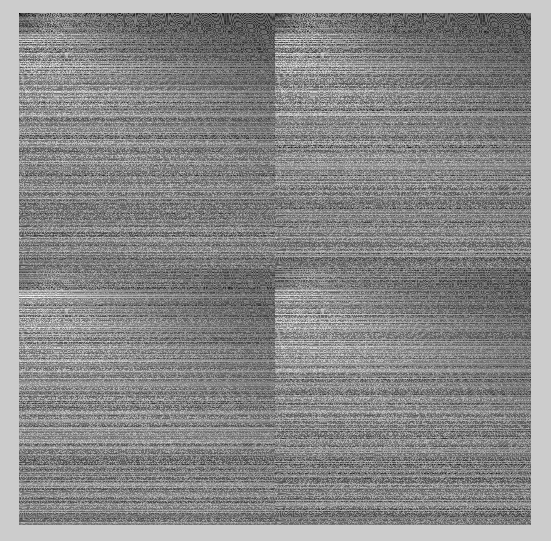
Where do the biggest errors occur? I scaled the deltaE image so that the maximum value was unity, converted it to gamma = 2,2, and here’s what it looks like:
There are errors near the black point where there is little blue. There are errors when blue and green are low that get worse when red is high, and better as blue goes up. There are low-level errors when blue is high.
If we do the above conversion in Matlab quantizing to 16 bit unsigned integer precision, we get much lower errors. The average is 0.0011, the standard deviation is 0.00005, and the worst case is 0.0047.
If we look at the normalized and gamma-corrected error image, we see a pronounced lack of “hot spots”:
Zooming in, it looks like this:
When we make the complete round trip in Photoshop from sRGB to Adobe RGB and back, we get lower errors: an average error of 0.0021, a standard deviation of 0.0058, and a worst-case error or 0.2160. That leads me to believe the the one-way errors we see above may be due to differences between the Ps and Matlab implementations of the sRGB nonlinearily definition, the Adobe RGB nonlinearity definition, or both.
Here’s what the error image looks like,, normalized to the worst-case error:
If we zoom in, we see this:
The same round trip in Matlab gives us these errors: average = 0.00006, standard deviation = 0.00008. worst-case = 0.0077.
The error image is:
A closeup looks like this:
Again, the Photoshop errors look more systematic.
What if we bring the sRGB image into Ps, convert it to Lab and back, and look at the differences? Now the average error is 0.0040, the standard deviation is 0.0033, and the worst-case error is 0.0759, which is quite credible.
Here’s what the error image looks like — remember, the errors are magnified since the worst-case error, the controller of the normalization, is so low:
Here’s a closeup of the upper left corner, with the errors multiplied by 20:
This looks pretty good. Overall, the Photoshop errors are higher than I got doing the equivalent calculations in double precision floating point, and there is some patterning in the error image, but the Photoshop errors look pretty good when judged on an absolute scale.


Leave a Reply