This is the fourth in a series of posts on the Sony a7RIII (and a7RII, for comparison) spatial processing that is invoked when you use a shutter speed of longer than 3.2 seconds. The series starts here.
I have received questions about the way that I’m testing Sony cameras to determine under what conditions they employ the spatial filtering algorithm known in some circles as “star-eating”. Some have said that the right way to see if a particular setting makes the camera eat stars, then you ought to point your test camera at star fields.
I beg to differ.
Engineering is blessed with a long history and a well-trodden path for testing equipment. You want a test that is repeatable. When you run it again, you want to get the same answers (within acceptable limits). You want a test that is reproducible. When others run the test, you want them to get the same answers. You want a test that is specific. The results of the test should ideally relate to the phenomenon of concern, and only to that. The test should be quantitative. It should also be objective.
Starfield photography is not repeatable. There are uncontrolled focusing errors, and atmospheric conditions change from night to night and shot to shot. It is not reproducible for the same reason. The results are not specific to the spatial filtering algorithm in the camera; many other things affect the captures. Unless you are counting thousands of stars for each photograph, it is not quantitative. And the presence or absence of a star is not something that is objectively determined in the tests that I’ve seen; I’ve never even seen anyone propose an objective criterion.
In engineering, if you want to test for something, you usually devise a test protocol for that measurement. In the case of gear that responds to the world, that means devising a stimulus that is repeatable, reproducible, and calculated to excite the behavior that you’re attempting to measure. It also means controlling the test conditions and coming up with a way to observe the response, measure the relevant parameters, and convert them to numbers (binary numbers count).
This usually makes the test quite different from the device under tests intended use. Let’s take sound reproduction as an example. If I’m testing an amplifier that is designed to reproduce music, I don’t usually do that by feeding music into the amplifier. Instead, I feed the amp signals designed for the test. If I want to measure continuous output power, I might use sine waves of various frequency, or white or pink noise. If I want to measure some kinds of nonlinearities, I might also use a sinusoid, or I might use two of them at the same time, measure the response at the sum and difference frequencies, and report the results as something called intermodulation distortion.
The stimulus that I’m using for the spatial-filtering testing is a dark-field image. There are a number of advantages for such an image for this kind of testing.
- It’s easy to obtain
- It’s unlikely to be different from capture to capture, temperature changes being the most likely cause of variation within one test sample.
- The differences from one test sample to another are likely to be readily measurable in the frequency range of interest, and it is possible to devise a response measurement technique that is insensitive to amplitude variation, which is the most likely source of differences from sample to sample.
- The ideal behavior, flat frequency response in the frequency range of interest, is easy to observe, given the correct postproduction.
When you capture a dark frame image, you are looking only at read noise (RN). There are three components to RN, a frame-to-frame invariant pattern, a pattern that varies from frame to frame, and a random component. If you turn up the ISO setting far enough (I use ISO 1000 for the a7RII and III), the random component dominates the other two. The nice thing about the random component is that its spectrum is white, meaning all frequencies are equally represented.
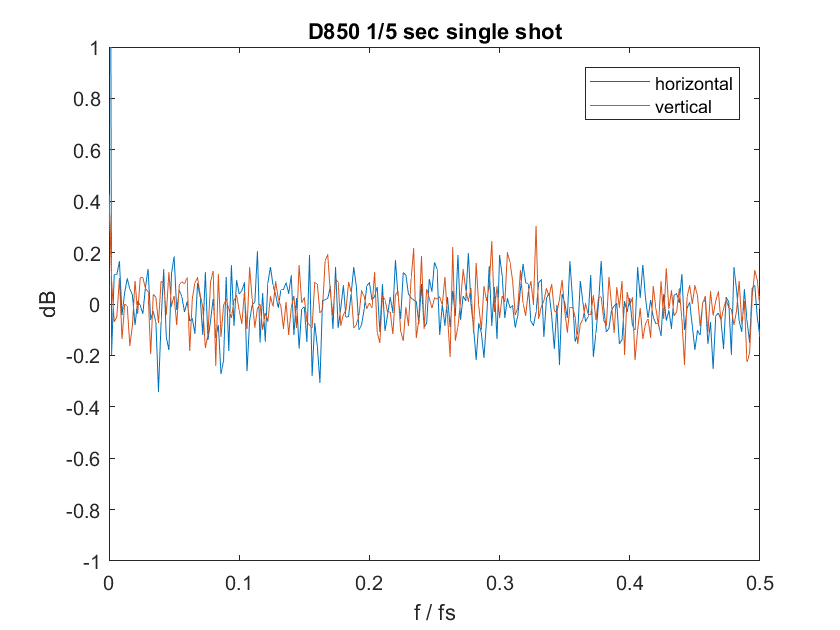
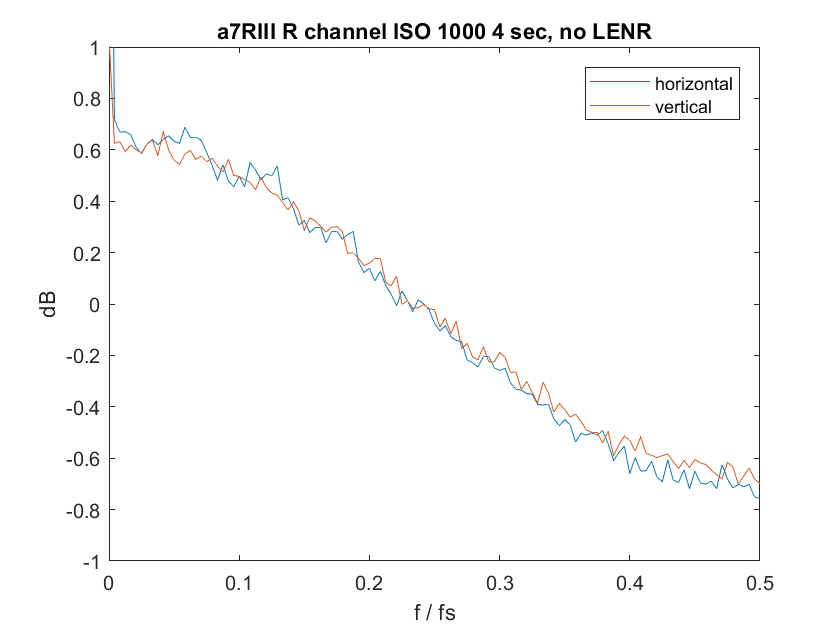
When you do a Fourier transform of white noise, you get more white noise, and when you convert that to graphs of the horizontal and vertical components, you get a noisy flat line.
If you look very carefully at the top left corner of the graph, you can see a very strong component near zero frequency. That’s the pattern read noise at work, and we can ignore it for the purpose of this testing.
While I’m on the subject, there have been some that have remarked that a 1.6 db swing from the lowish to the high frequencies when the a7RII or III is in star-eater mode is not much:
That is beside the point. The hot-pixel removal algorithm was intended to remove outliers, and has a much greater effect on them than it does on Gaussian white noise, which has a low probability density function in the range where the hot-pixel software does most of its work. The effect of the algorithm on white noise is an accident, and, in this case, a lucky one, since it allows us to see the signature of the algorithm at work.
Because the Fourier transform of white noise is noisy, so are the graphs I plot. One of the things that I do to make them easier to interpret is to smooth them by averaging over groups of frequencies. I don’t always use the same number of frequencies for averaging, depending on which setting makes the intent of the graph clearer. So you shouldn’t attach any meaning to the random variations in the graphs, only to the systematic ones.


The Fourier Transform certainly indicates the presence of spatial filtering but it takes more than that to determine the exact effect on stars. For instance to determine the difference between the v3.3 and v4.0 algorithms.
Well, sure, but it would be quite a coincidence, wouldn’t it? I’m gonna look at some PDFs.
It’s a good question! One that I can’t immediately answer. However my analysis of raw files and the “pixel pairing” artifact suggests an important difference between the v3.3 and v4.0 algorithms. Green pixels are far more likely to survive the v4.0 algorithm. So the green parts of a small star survive and the star remains visible. I believe this is why Drew Geraci and Rishi see a difference. But for reasons unknown, it is not apparent in the Fourier Transform.
Jim,
You will never win an argument with a Sony fanboy, just as I will never win one with my mother in law.
I don’t see any fanboys here.
“you ought to point your test camera at star fields”
Fannish
“You want a test that is repeatable. When you run it again, you want to get the same answers (within acceptable limits). You want a test that is reproducible. When others run the test, you want them to get the same answers. You want a test that is specific. The results of the test should ideally relate to the phenomenon of concern, and only to that. The test should be quantitative. It should also be objective.
Starfield photography is not repeatable. ”
Neither is photographing tree leaves for sharpness testing.
I agree about the trees. I also do more scientific sharpness testing, and for precisely those reasons, and others. But I do the foliage shots anyway. Here’s why.
Some people don’t like the quantitative lab tests I run. Many have a hard time interpreting the numbers and the graphs. Also, the lab tests take a long time to run. I don’t have enough time to test all the things I want to test as it is. So I supplement the lab work with these quick visual tests. They also allow direct comparison without needing numerical skills on the part of the reader.
Foliage has some advantages for this. It is not regular. People know what it should look like. It moves from shot to shot, so people won’t look at things that depend on the subject’s alignment with the sampling grid. If there’s sky, it’s great for observing CA. A big advantage for me is that it’s handy. If I had to drive to do these tests, I’d do a lot fewer of them. Last, and maybe least, it has a long history in photographic lens testing; AA recommended it; although he liked bare tree branches against the sky, too. Not too easy to find a lot of those where I am.
Yes, foliage has disadvantages. It moves, and I have to plan my shutter speeds accordingly. It’s green, so the wavelengths for a camera with a good IR filter are in its sweet spot.
I interpreted it differently, as a comment by someone who has not been exposed to the virtues of indirect, repeatable testing.