This is the third in a series of posts about the Sony alpha 9 Mark II, aka the a9II. The series starts here. You can find other posts in this series by using the category list on the right, and selecting “a9II”.
You can find out a lot about the digital signal processing inside a camera by looking at the spectra of dar-field noise. In the absence of any processing or anolmolies, this noise is white, which means that all frequencies are equally represented in the spectrum. Heating and global variations across the chip means that in the real world, the spectra have more energy at low than high frequencies, but the spectra will be smooth. Spikes, peaks, and valleys in the spectra indicate the effects of digital signal processing. We see this a lot more often than we used to, thanks at least in part the the prevalence of on-sensor phase-detection autofocus.
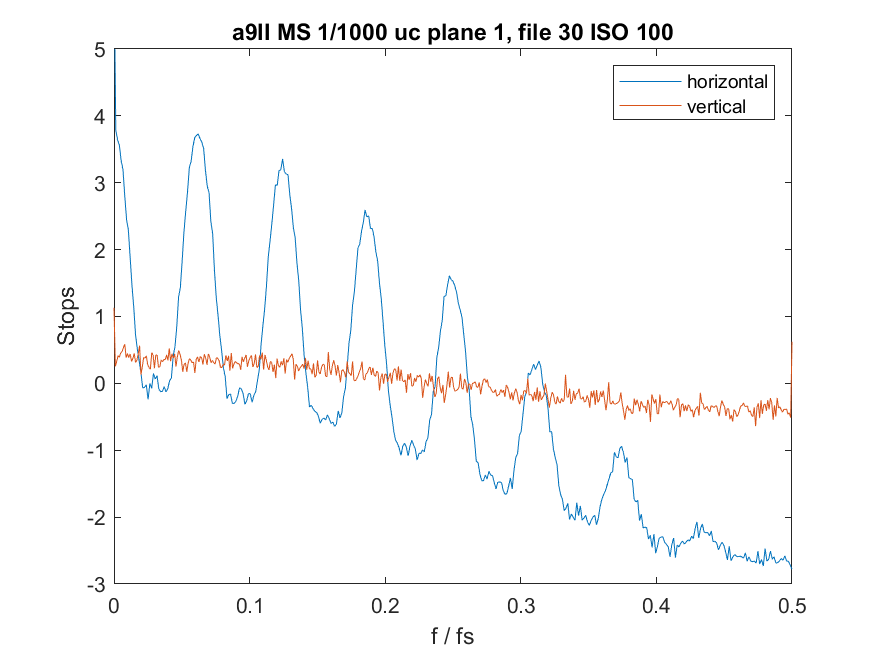
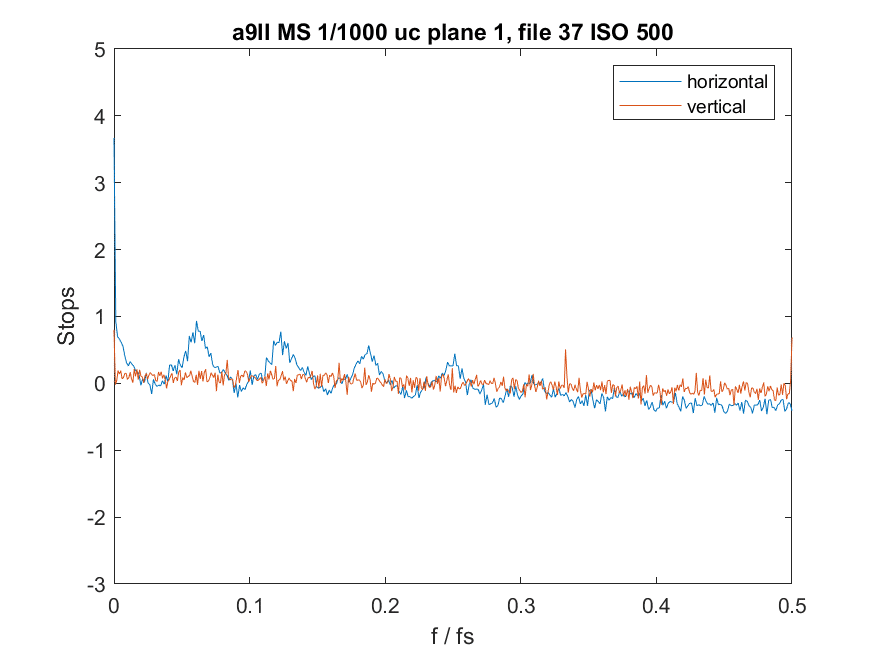
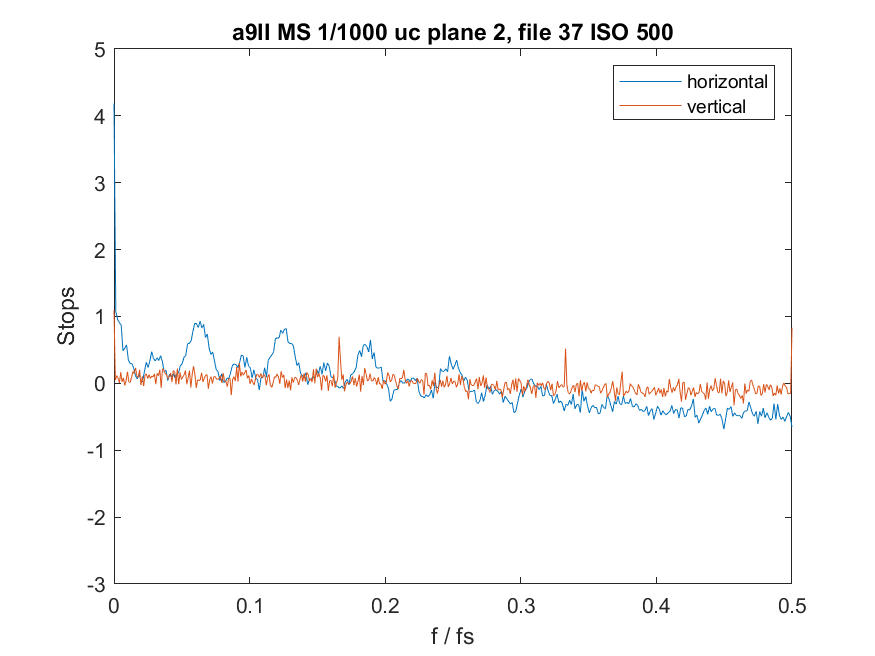
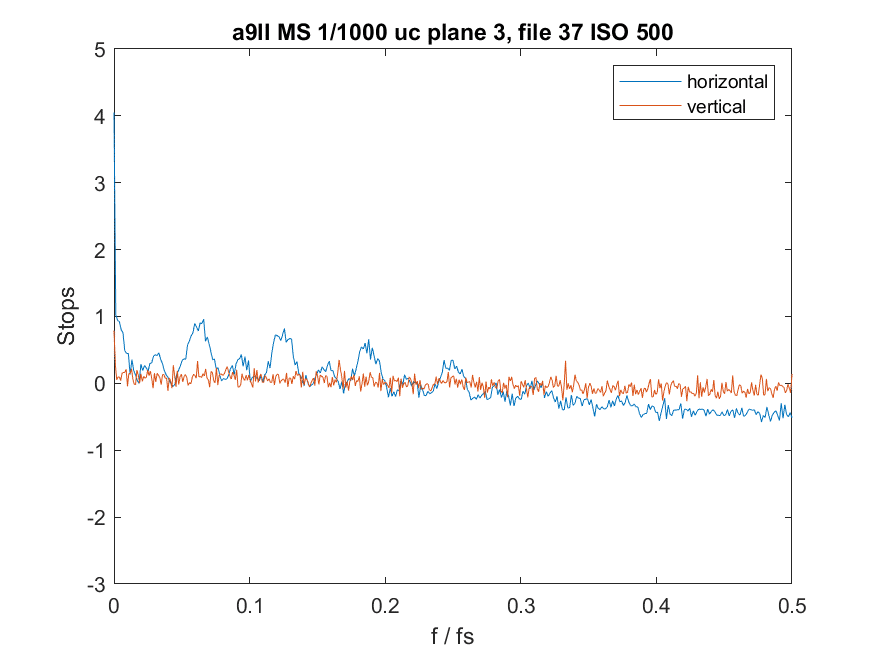
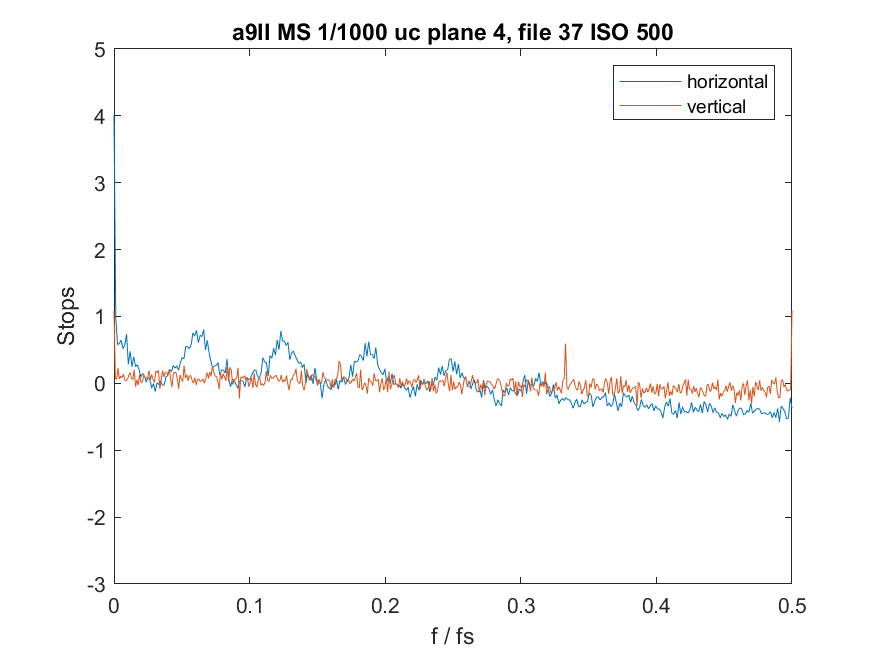
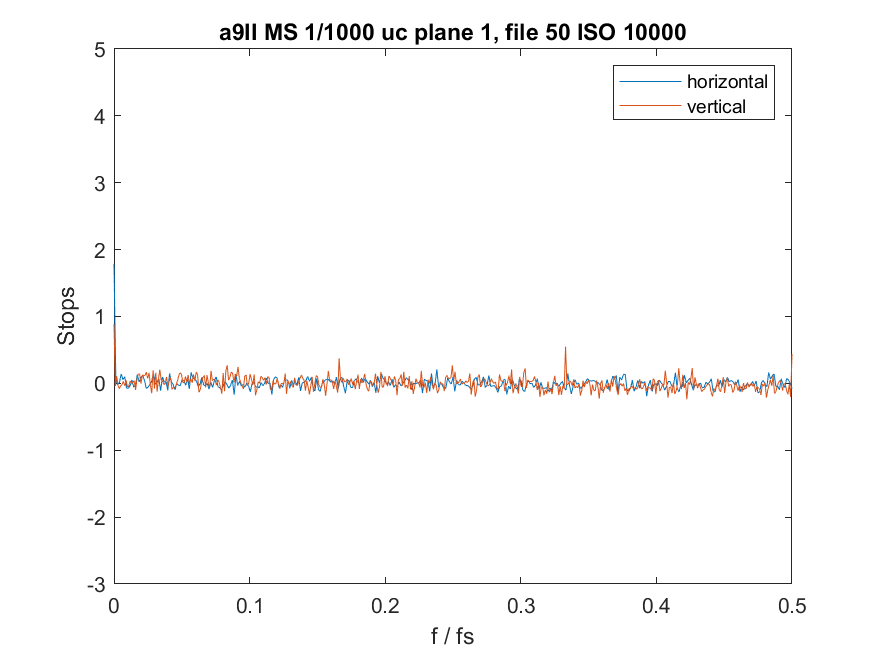
Here’s what the four raw planes of the a9II look like at base ISO with the mechanical shutter and uncompressed raw recording:
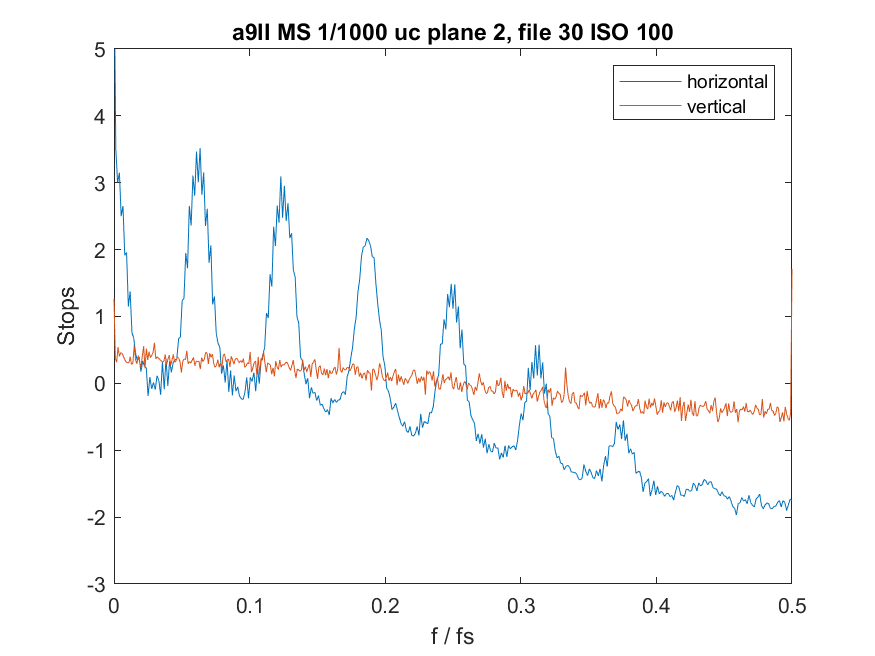
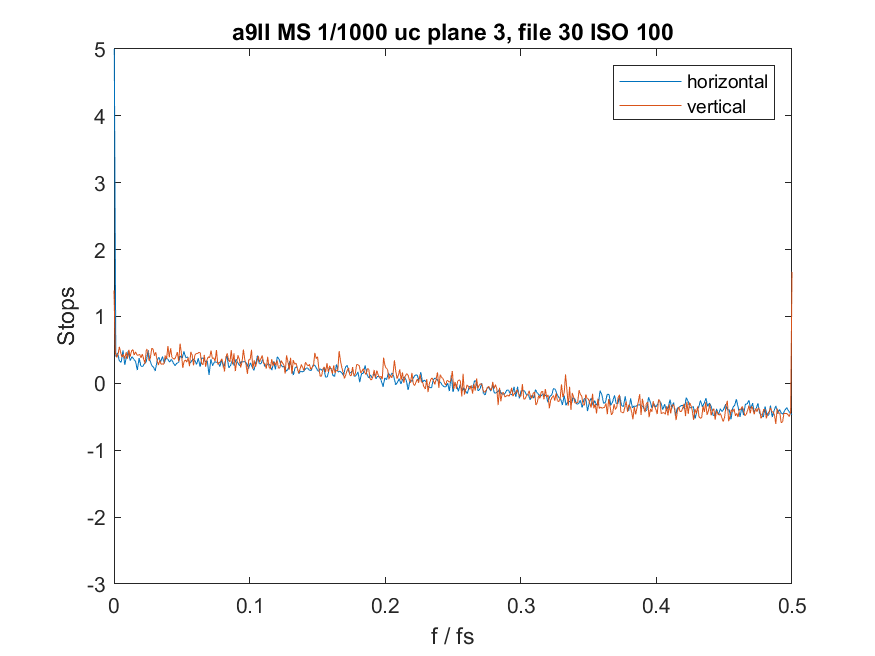
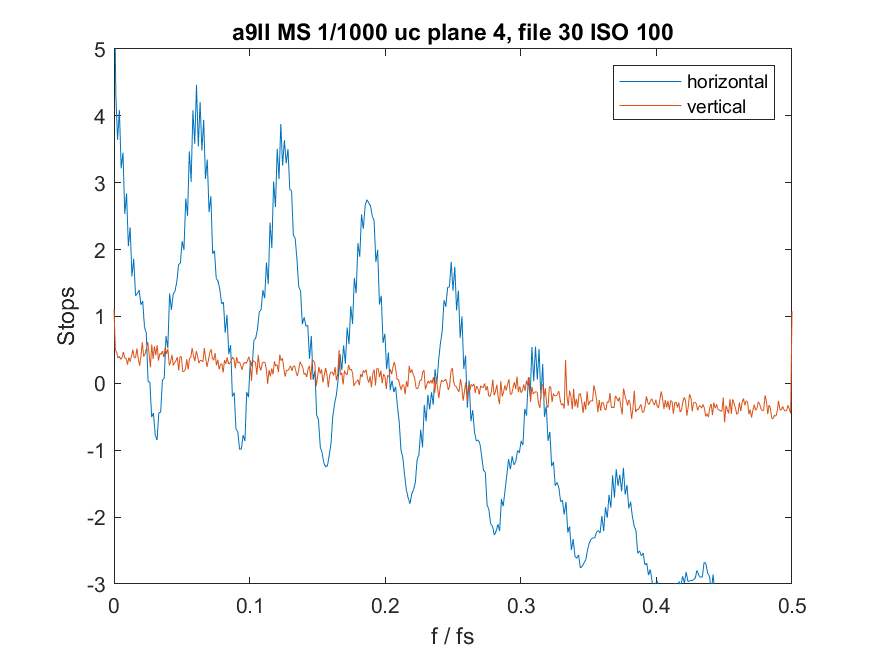
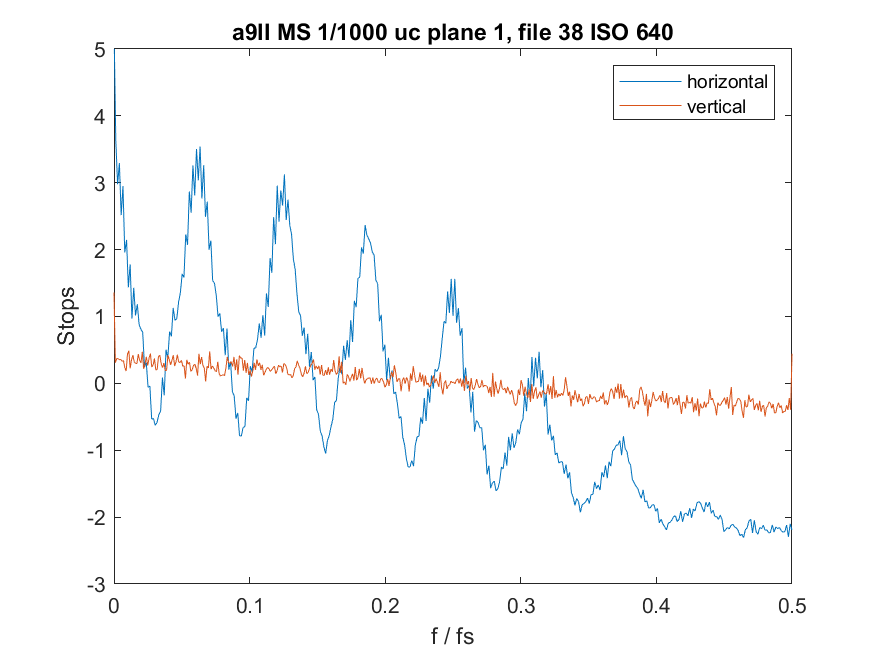
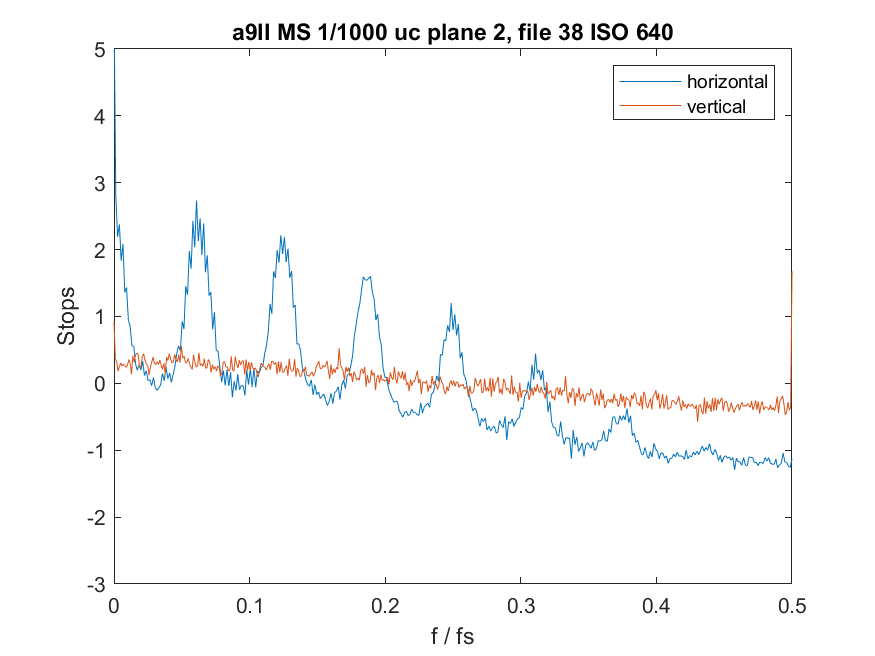
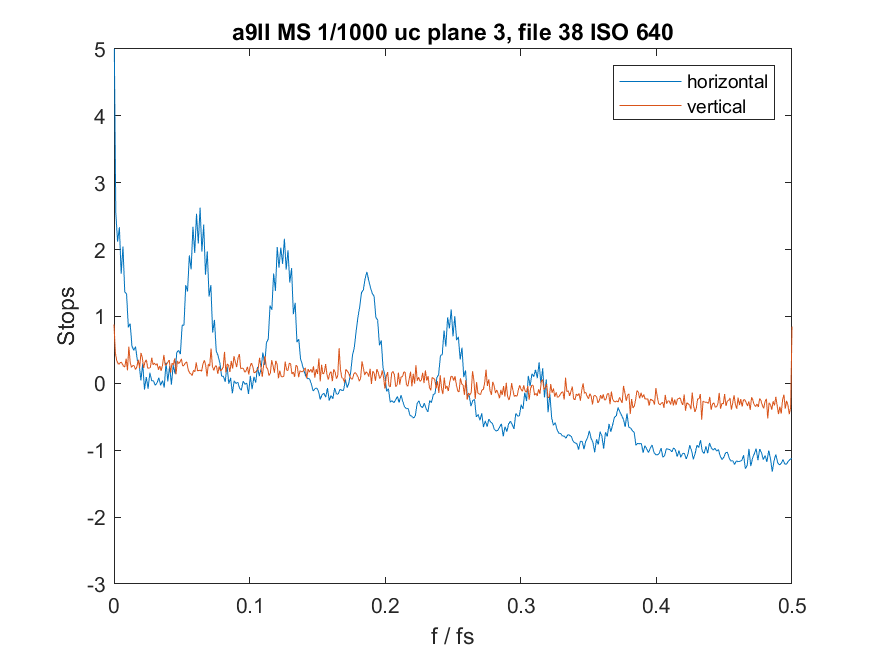
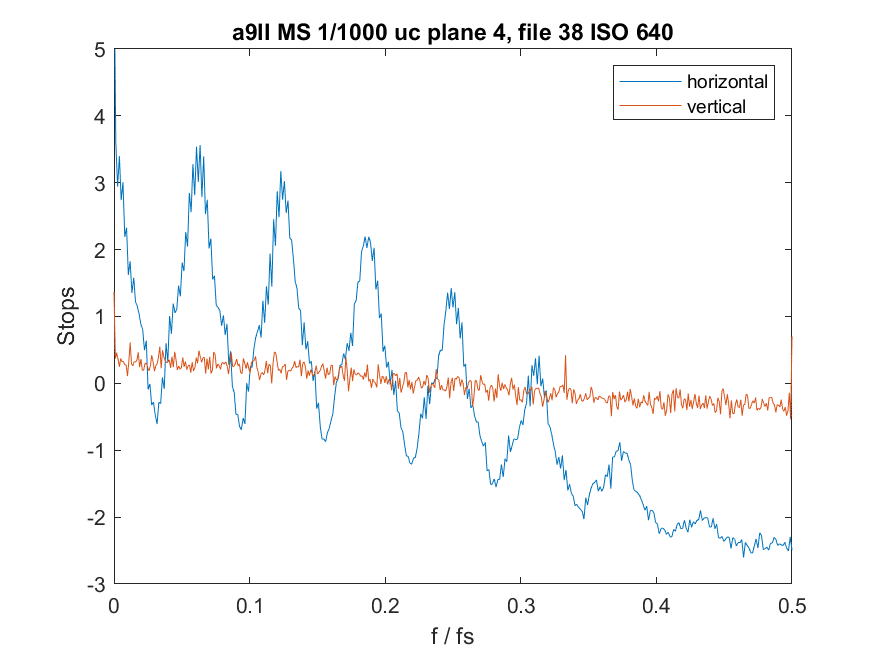
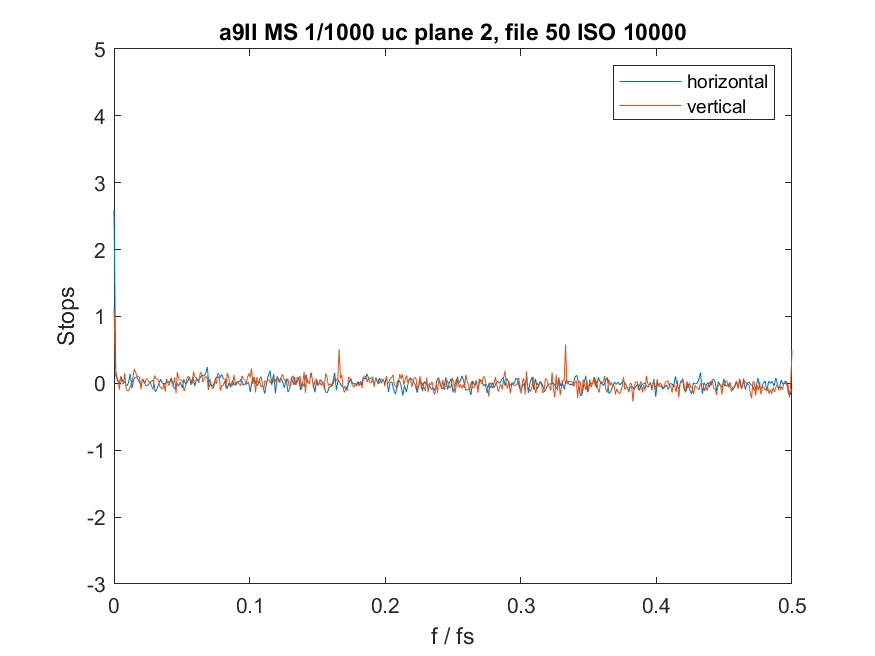
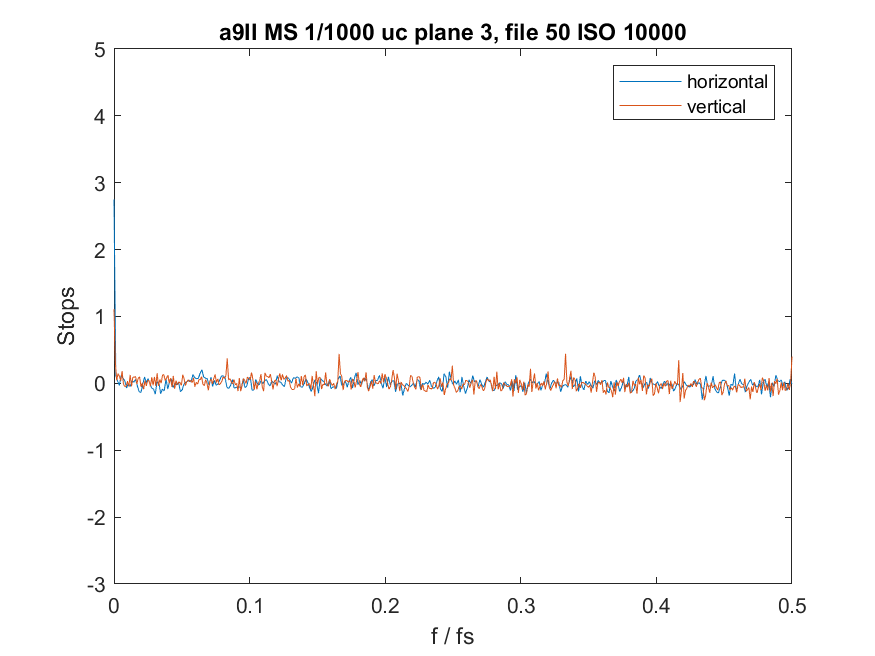
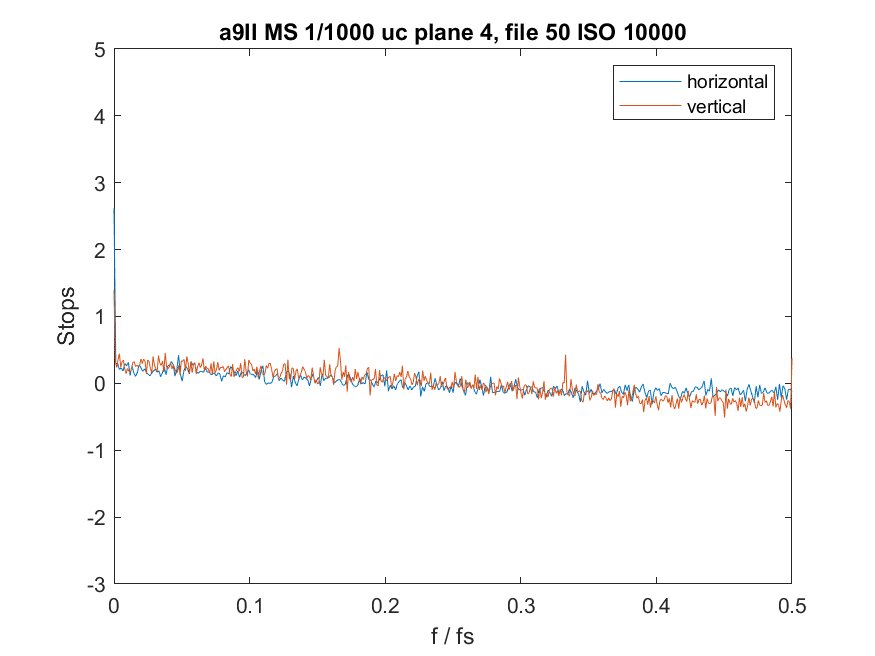
Plane 1 is the red plane. Planes 2 and 3 are green, and plane 4 is blue. The horizontal axis is frequency divided by fs, which is the sampling frequency, so 0.5 on the horizontal axis is the Nyquist frequency for the sensor. You can see that the spectrum looks smooth and clean vertically, but has a jagged high-frequency rolloff in the other direction.
The first green plane look like the red plane, but the second green plane is clean in both directions.
The blue plane is the worst of them all.
More read noise makes things better, and the curves are smoothing down at ISO 500:
Plane 3, which was looking immaculate at ISO 100, now looks like the other planes.
Note the spikes in the vertical direction at 1/3 and 1/6 of the sampling frequency. Since the sampling frequency is computer per plane, this is at 1/6 and 1/12 of the sampling frequency for the entire sensor.
At ISO 640, the read noise goes down and the variation gets worse:
At high ISO’s everything in the horizontal direction smooths out:
Ilya Zakharevich says
Jim, since there is an ambiguity in horizontal/vertical, let’s try to make unambiguous:
• I presume that there is an ADC per every column on the sensor (or maybe 2: one for green, one for R/B) reading the sensels in this column 1-by-1;
• So the comb on the graphs (with the step ¹⁄₁₆ of the Nyquist) should be either
∘ For pixels read by one ADC (with period 32 or 16, depending on how many ADC/column);
∘ For pixels read by different ADC (with period 16 AMONG different ADC⸣s).
Which one do you think it is?
And: I do not remember: taking the period of the comb for other Sony sensors, is it also Nyquist/16?
Ilya Zakharevich says
One more question: IIRC, the graphs above are from 600×1000 excerpt. If so, and IF the groups of 16/32 are involved, then since 600 and 1000 are not multiples of 16 (neither of 32 ;-)), cannot this hide some fine details of the combs?