This is one in a series of posts on the Fujifilm GFX 100. You should be able to find all the posts about that camera in the Category List on the right sidebar, below the Articles widget. There’s a drop-down menu there that you can use to get to all the posts in this series; just look for “GFX 100”.
Yesterday I posted some measurements made with the GFX 100 and the Fuji 110 mm f/2 lens that, when compared to two-year-old measurements made with the same lens on the GFX 50S, showed that, by one measure, the pixel level sharpness of the GFX 100 was less than the GFX 50S, and the picture-level sharpness was about the same. That was a sufficiently interesting result that I thought it worthwhile to do a side-by-side test so that I could made sure the lighting, target distance, target orientation, and so forth were all the same. While I was at it, I looked at a more general metric than MTF50, which I used before. This time I used the whole MTF curve.
I’ll walk you through how I made the exposures and did the calculations, but if you want to cut to the chase, scroll down and look at the last graph.
Here’s the setup:
The target is a backlit double-edged razor blade, and it’s 1.5 meters from the camera. I made a series of focus-bracketed captures with both the GFX 100 and the GFX 50S, with the step size set to 1, the delay to 0, and using electronic shutter. I used a Fuji 110 mm f/2 lens for both series. Then I analyzed the raw files, and picked the image from each camera with the sharpest raw green channel. It turned out that for both cameras, that image also had the sharpest raw blue channel, but that the images with the sharpest raw red channel occurred when the focused distance was two or three shots closer. I examined the MTF curves for both sharpest images.
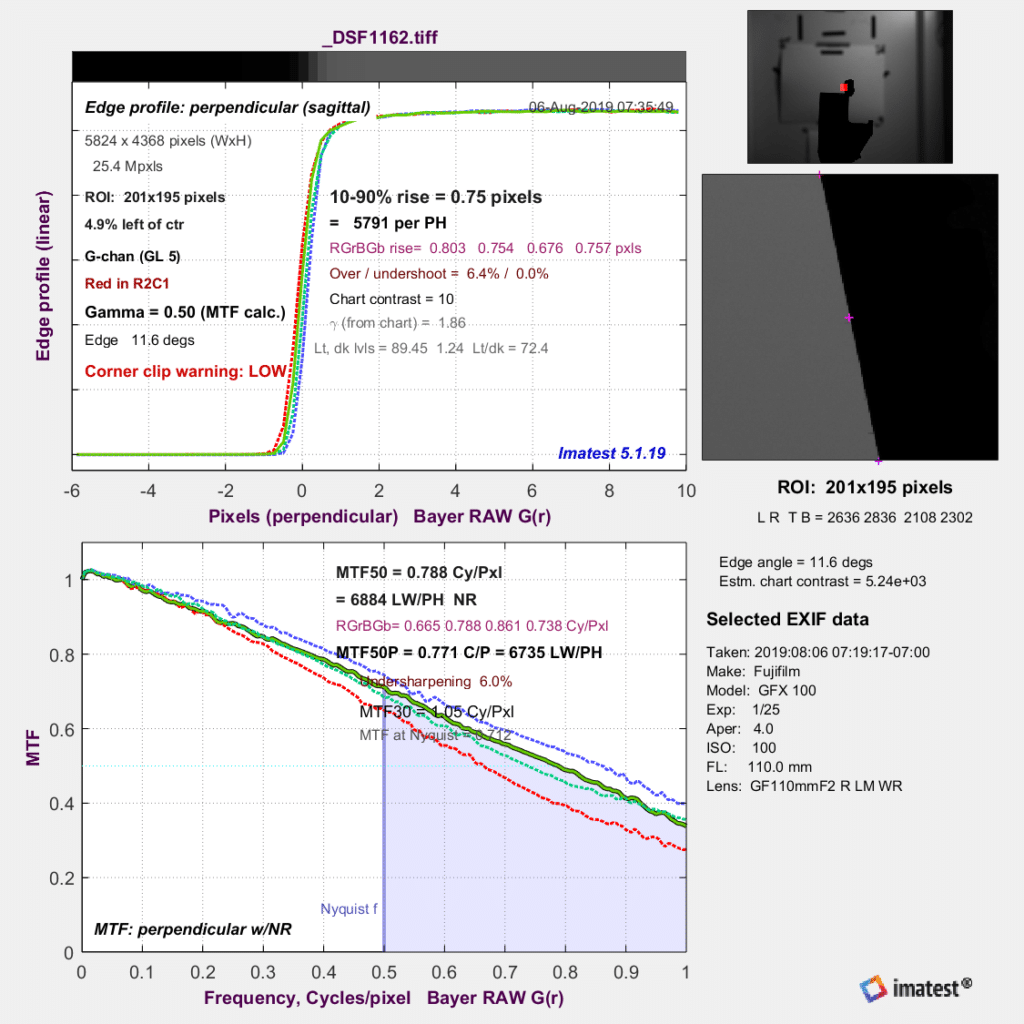
Here’s the GFX 100 one:
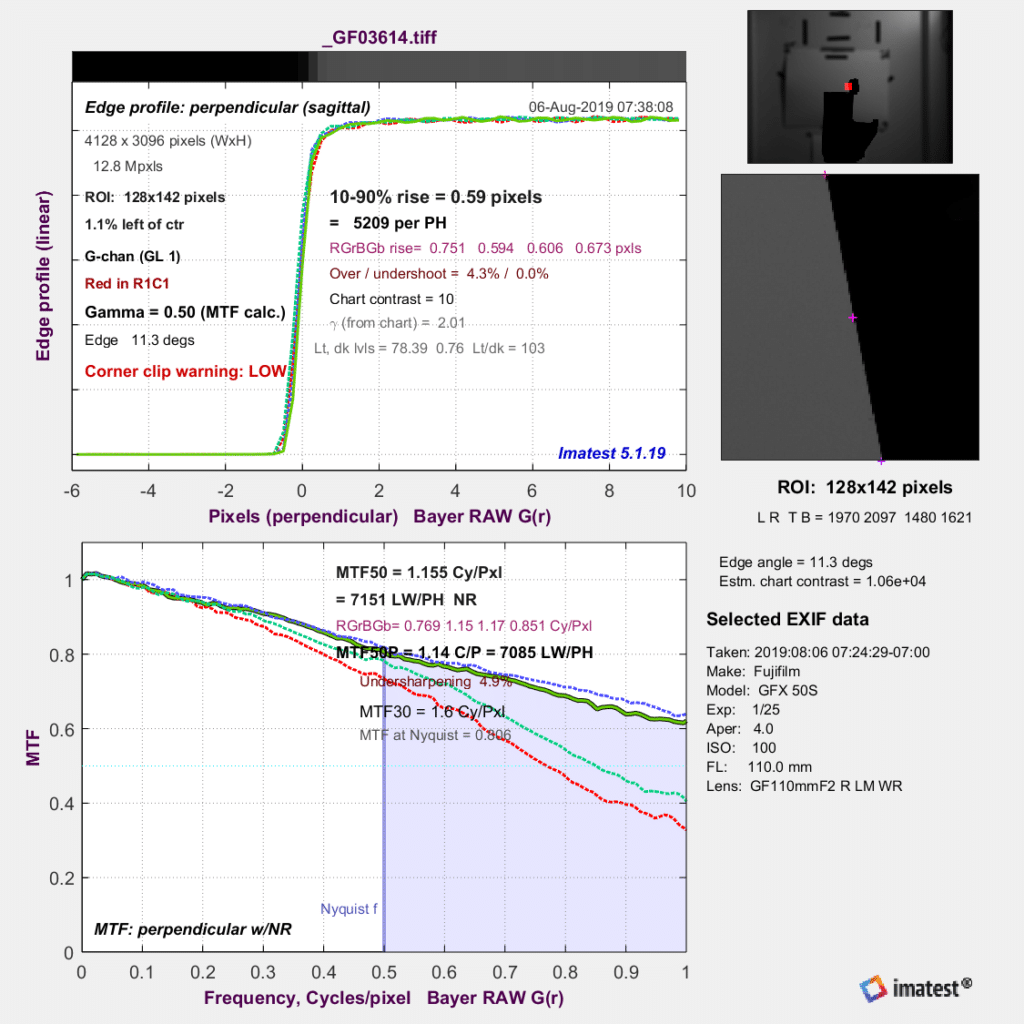
And here’s the GFX 50S sharpest image:
Even if you’re used to looking at MTF curves, the ones above need some explication. The Nyquist frequency is 0.5 on the horizontal axis. But because we’re looking at the raw planes, the Nyquist frequency for the entire sensor is 1 on the horizontal axis. It’s probably best to ignore the blue shading.
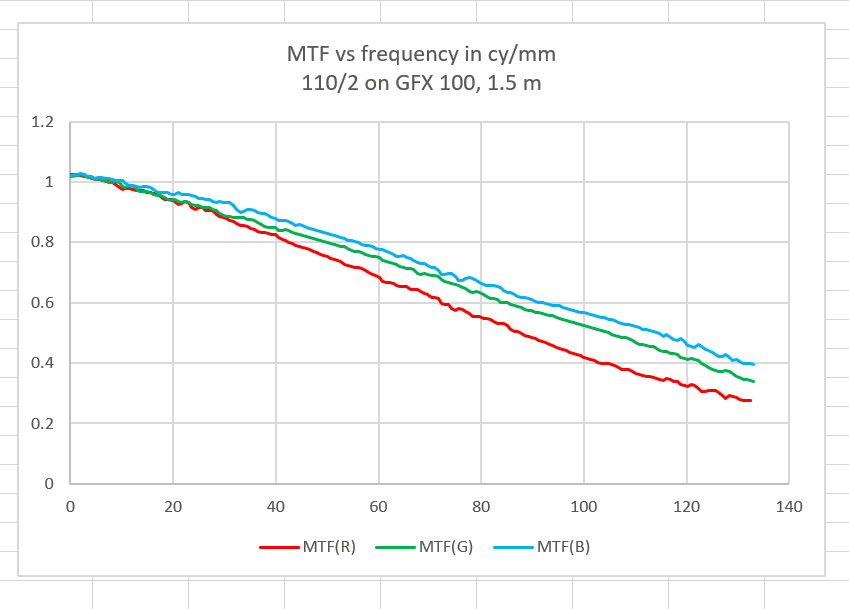
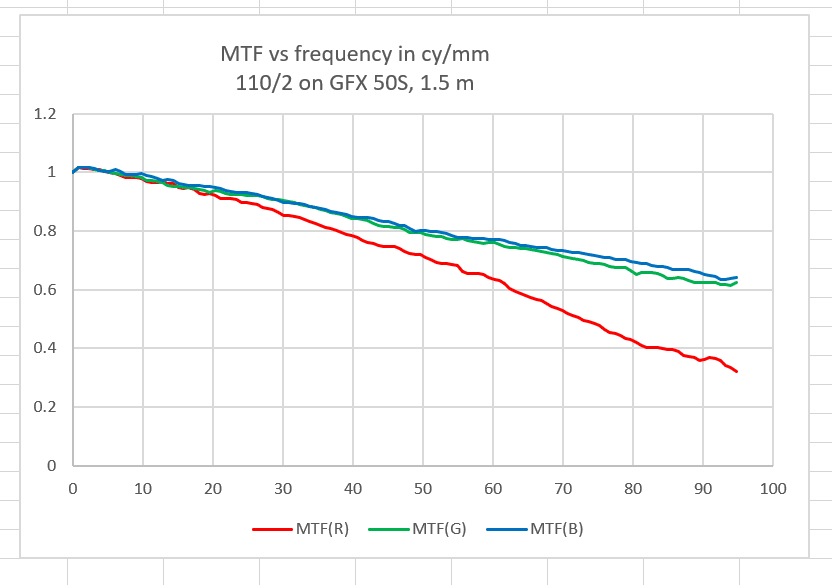
It’s difficult to make much of the data above, since the horizontal axis is in cycles/pixel, and the pixel pitch is different for the two cameras. So I exported the MTF curves to a spreadsheet, and calculated the horizontal axis in cycles/millimeter.
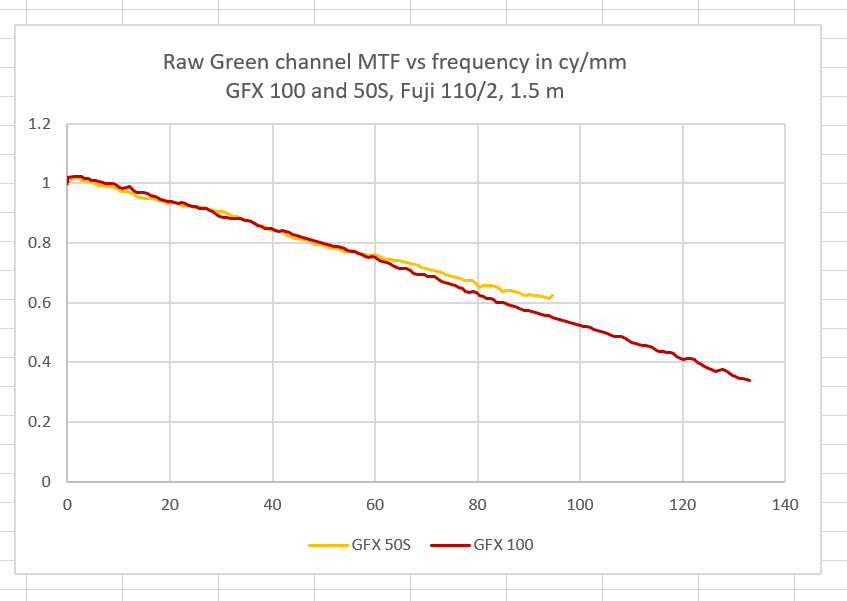
It’s stil not obvious what this is telling us. When I put both green channels on the came graph, things are clearer.
Now you can see that the GFX 50S has a higher modulation transfer function from about 60 cy/mm on up. That seems to imply that it has an even smaller effective fill factor than the GFX 100, in spite of the GFX 100’s much finer pitch (assuming the GFX 100 fill factor is 100%, this is a rough confirmation of Jack Hogan’s work on the GFX 50S microlens size a couple of years ago). Both curves stop at the Nyquist frequency for each camera. You can see that the GFX 50S, with an MTF of more than 0.6 at the Nyquist frequency, is more prone to aliasing than the GFX 100, with an MTF of about 0.35 at Nyquist. Both these numbers may be a bit high because of the high-contrast target, but I think the ratio should be approximately correct.

CarVac says
Perhaps the GFX-50s is focusing on the peak of the green (coincident with the blue) channel instead of a compromise between all three channels as the GFX-100 seems to?
That would explain why the GFX-50s’s MTFs are higher for the green channel, and also why the red channel MTF drops off faster.
JimK says
Good thought. I’m already using the smallest of the GFX focus bracketing step sizes. Ao to get finer, I’d have to dust off the Cognisys rail.
Jack Hogan says
Yesterday’s through-focus for the GFX-100 and the previous test of the GFX 50s LoCA did not rely on focus, though – and clearly suggest that the 100 has a relatively larger effective fill factor than the 50s.
There is a very easy way to find out because pixel aperture forces the MTF curve to zero before any other effect with a good quality in-focus lens at these f-numbers. In the past it wasn’t possible to read an estimate of the first null off the graph because such graphs typically did not extend beyond 1 c/p . However, the current version of MTF Mapper has an option to map the curve out to 2 c/p so – assuming an in-focus, long enough edge captured in a raw file – it should be pretty easy to estimate.
Jack
CarVac says
Why would the MTF fall off faster in the red channel only for the GFX-50s then?
Jack Hogan says
I understand the scale is different in the x-axis CarVac (the ’50s was controlled by the powered rail, while the ‘100 does its own stepping I believe).
JimK says
That is correct.
CarVac says
I meant the falloff in the red channel is faster with frequency in the MTF versus frequency plots here, not in the MTF versus focus plots.
Brandon Dube says
Hi Jim,
Just a data point – a diffraction limited F/4 lens at .525 um and a 3.76 micron square pixel aperture yield an MTF of 0.675 at 80cy/mm. A 3.65 micron square pixel aperture raises that to .723 (about the right size bump).
I’ll think about this for a bit. I had suppressed defocus when I estimated the fill factor because “big” defocus values were being generated by the optimizer. By turning that off I may have pushed it into a fill-factor over-estimation regime. I don’t think I have the dataset anymore, but if you want to send an edge_sfr_values.txt for the best focused image and one reasonably far away on each side, I’ll give it another whirl.
JimK says
Another wrinkle: because of the high-contrast target that I used, the MTF’s are probably somewhat overestimated.
Jack Hogan says
Frans is king on this but if the edge is sharp, technique is good and the raw data is not clipped/blocked – the kind of contrast in your samples should not affect MTF appreciably: since the LSF is the derivative of the ESF, within reasonable limits what counts is the slope not the distance between floor/ceiling. Imatest went to a low contrast target supposedly because folks were unwittingly clipping the data.